Dorsch Data
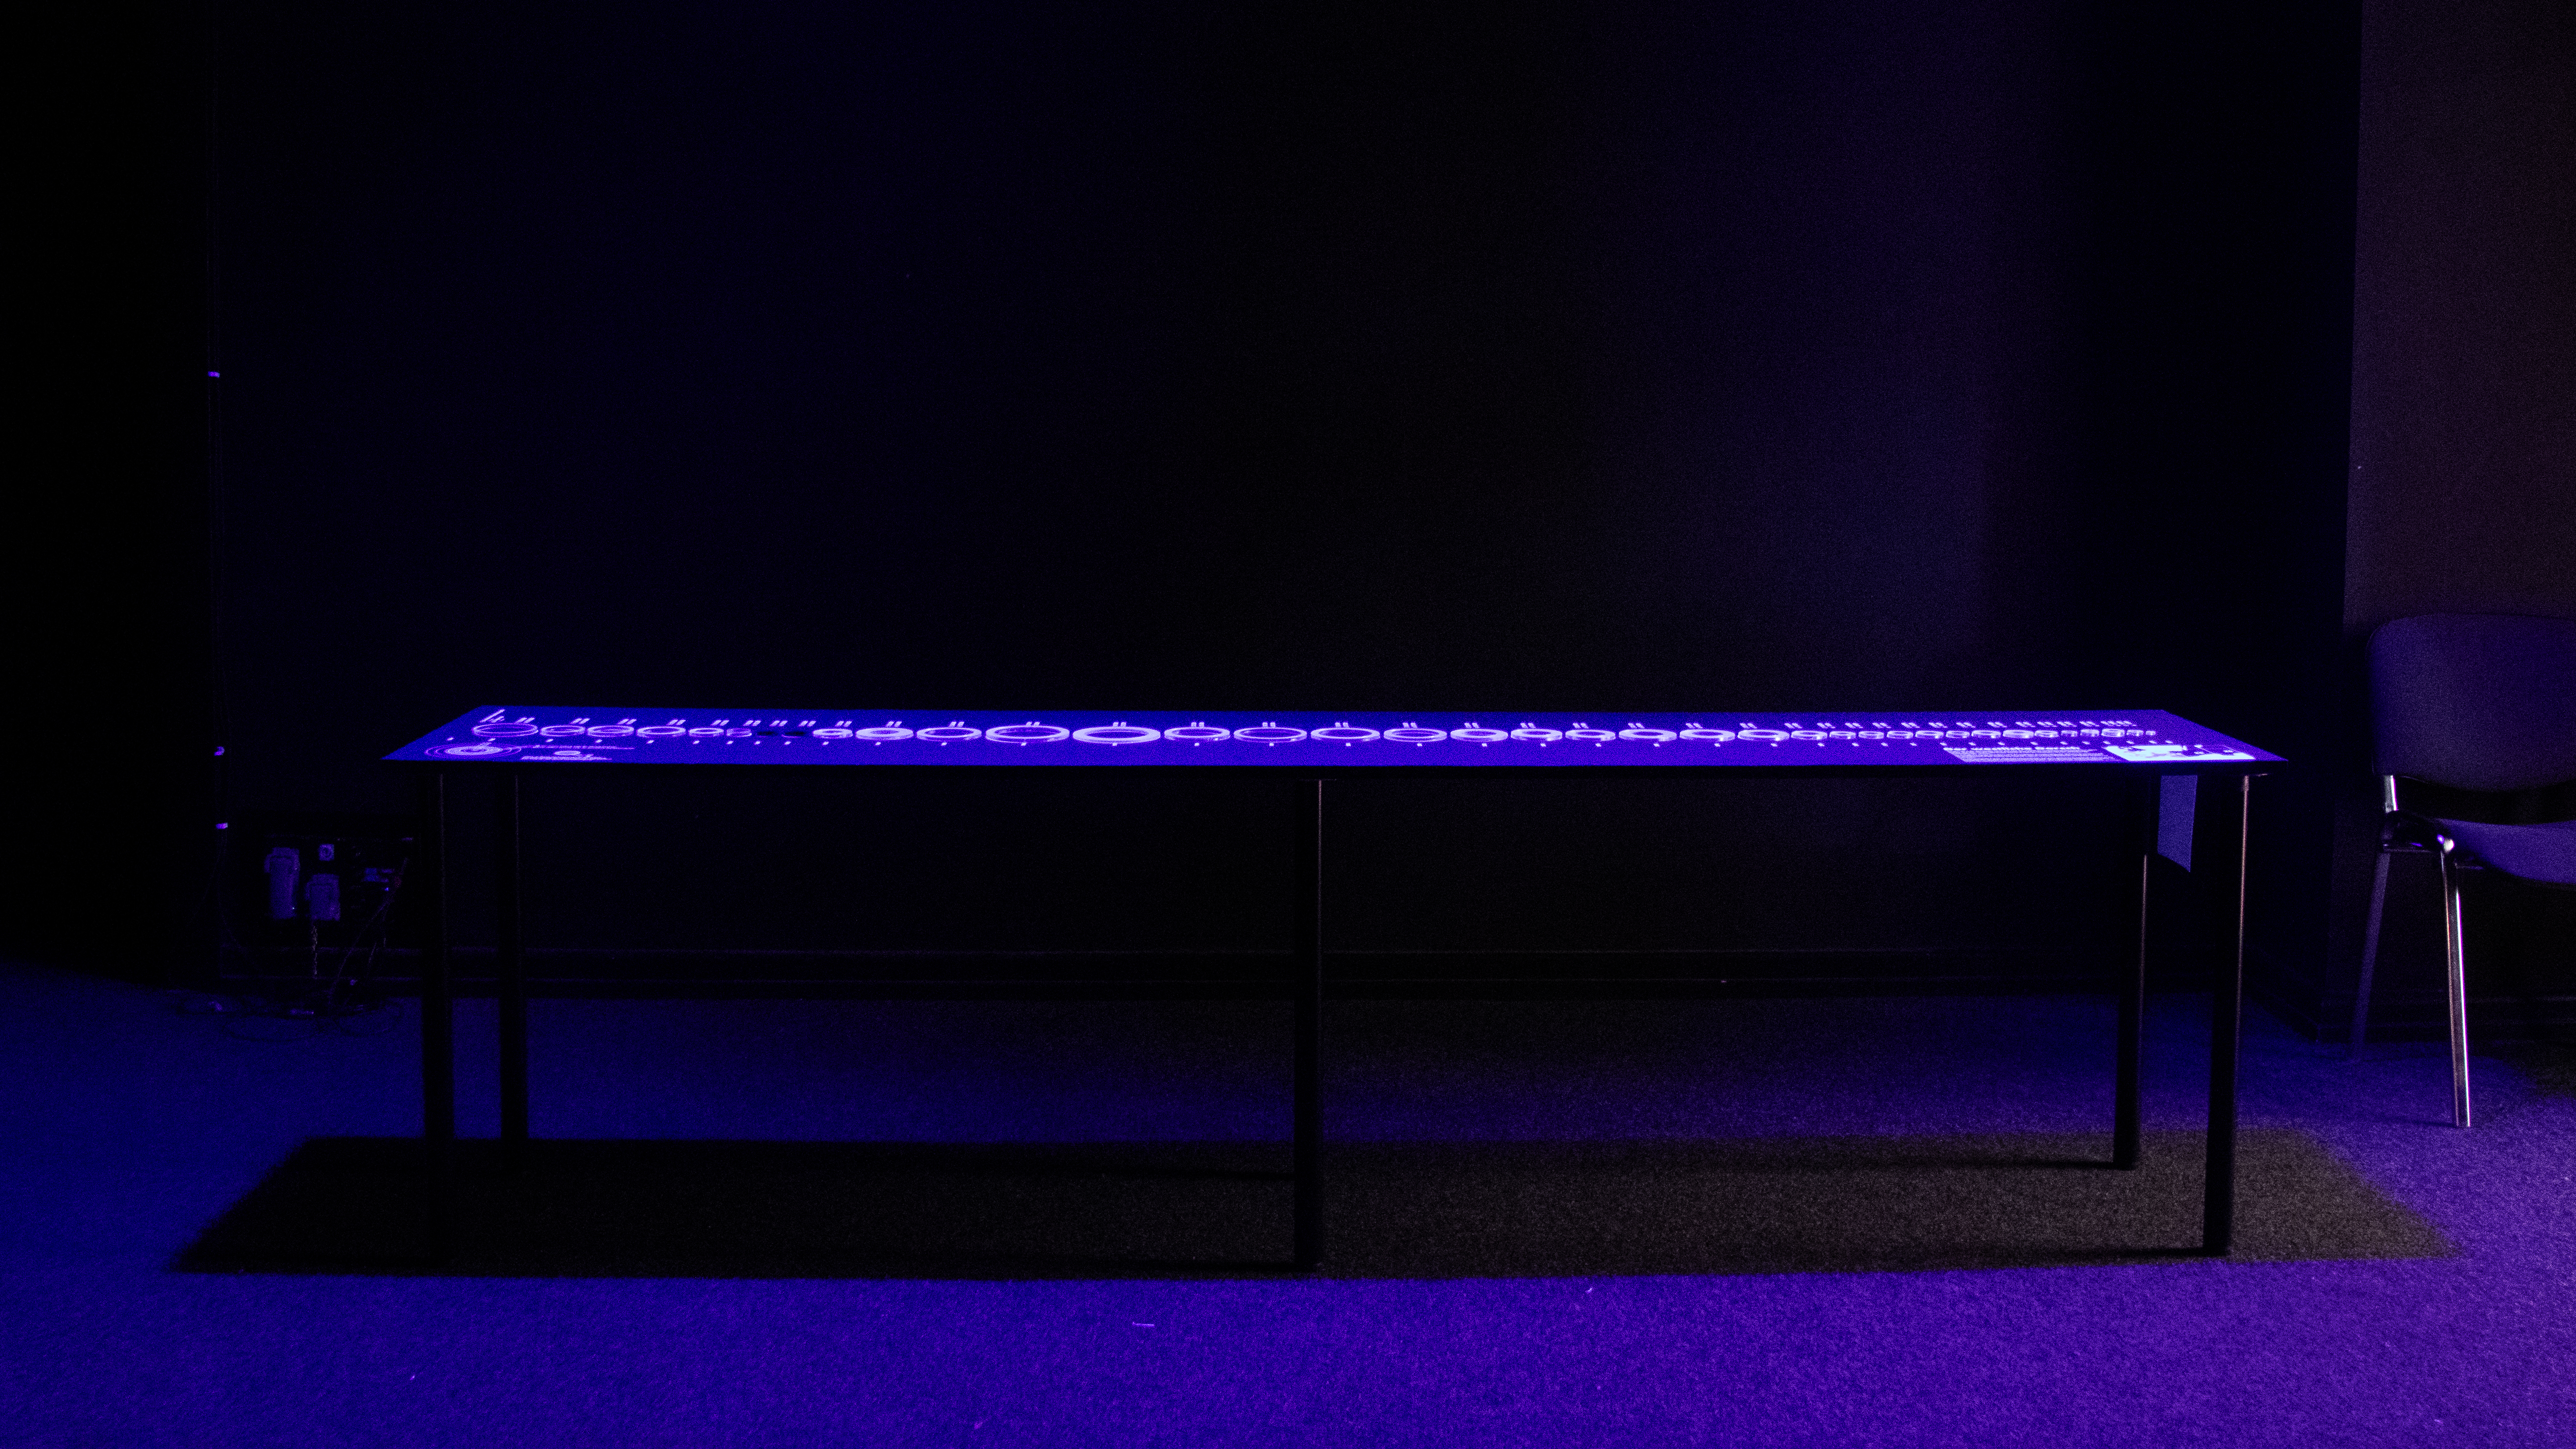
Dorsch Data is an installation that visualises the decline and near extinction of the cod population in the western Baltic Sea, focusing on the effects of overfishing.
| Year | 2024 |
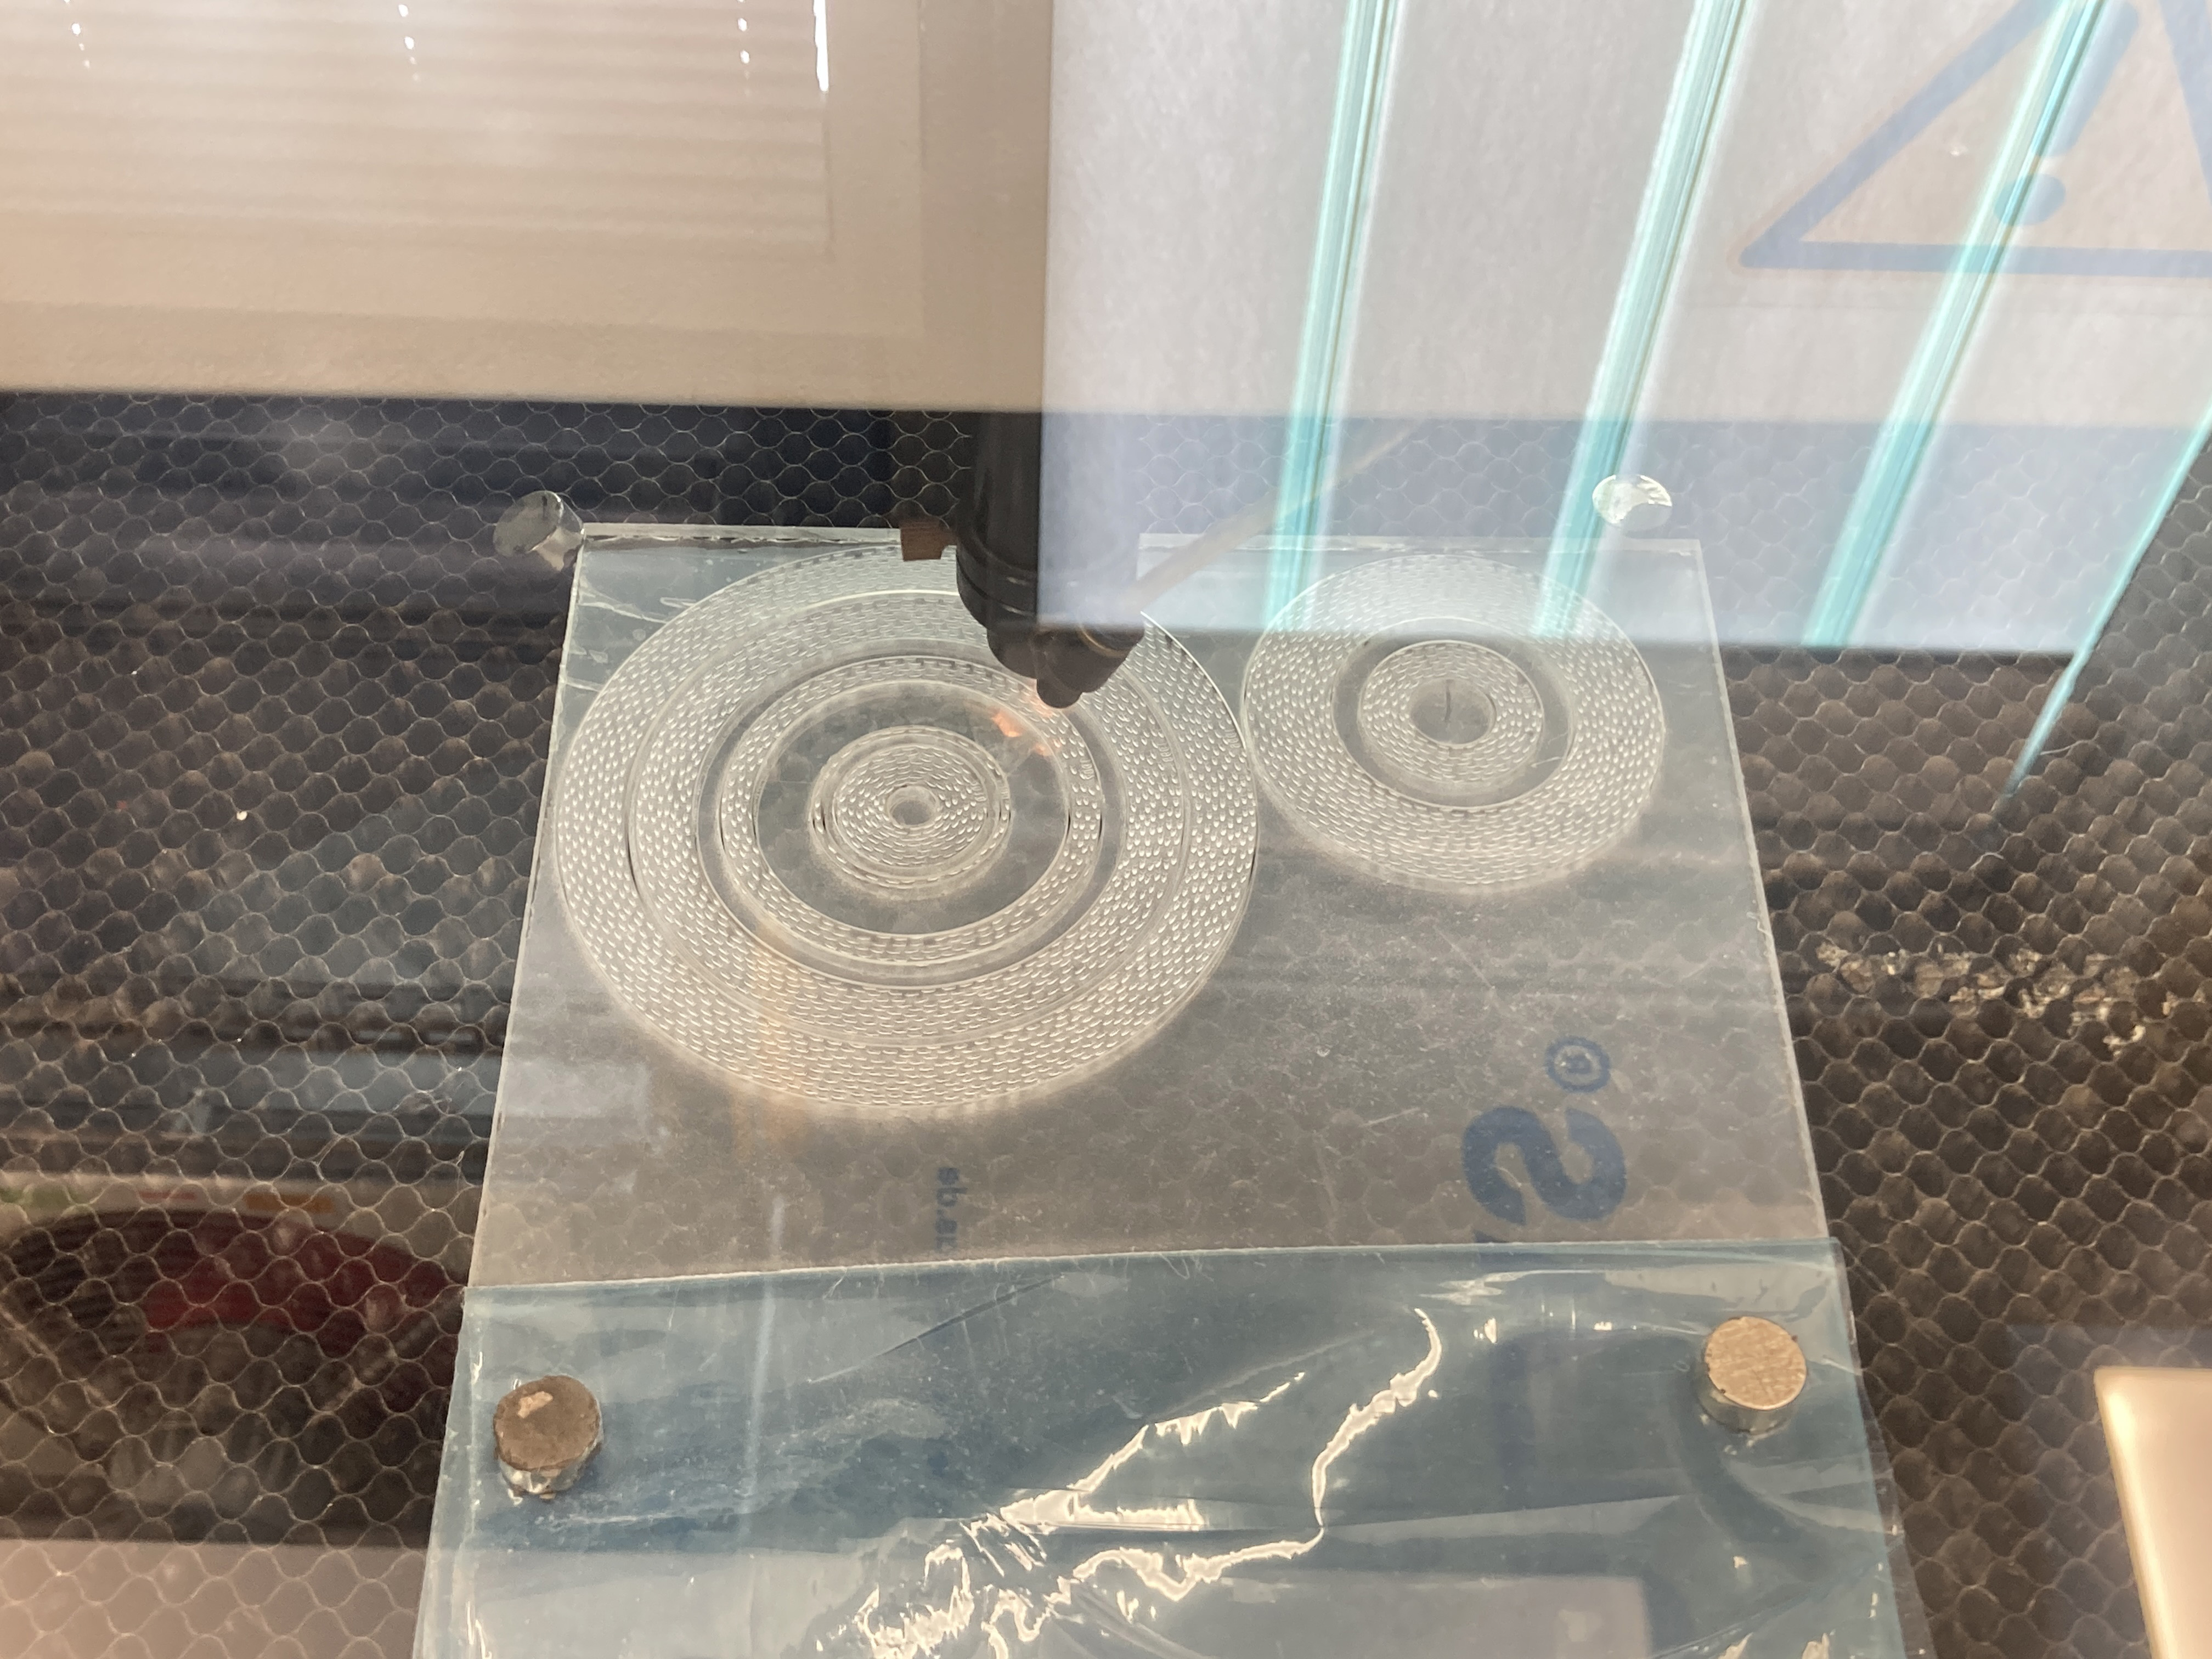
| Material | Clear Acetate, Paper |
| Production/Tools | Lasercut, Laserengraving |
| Dimension | 260 x 50 cm |
| Contact | linea.walker-friedrichs@mkh-mail.de |

Motivation:
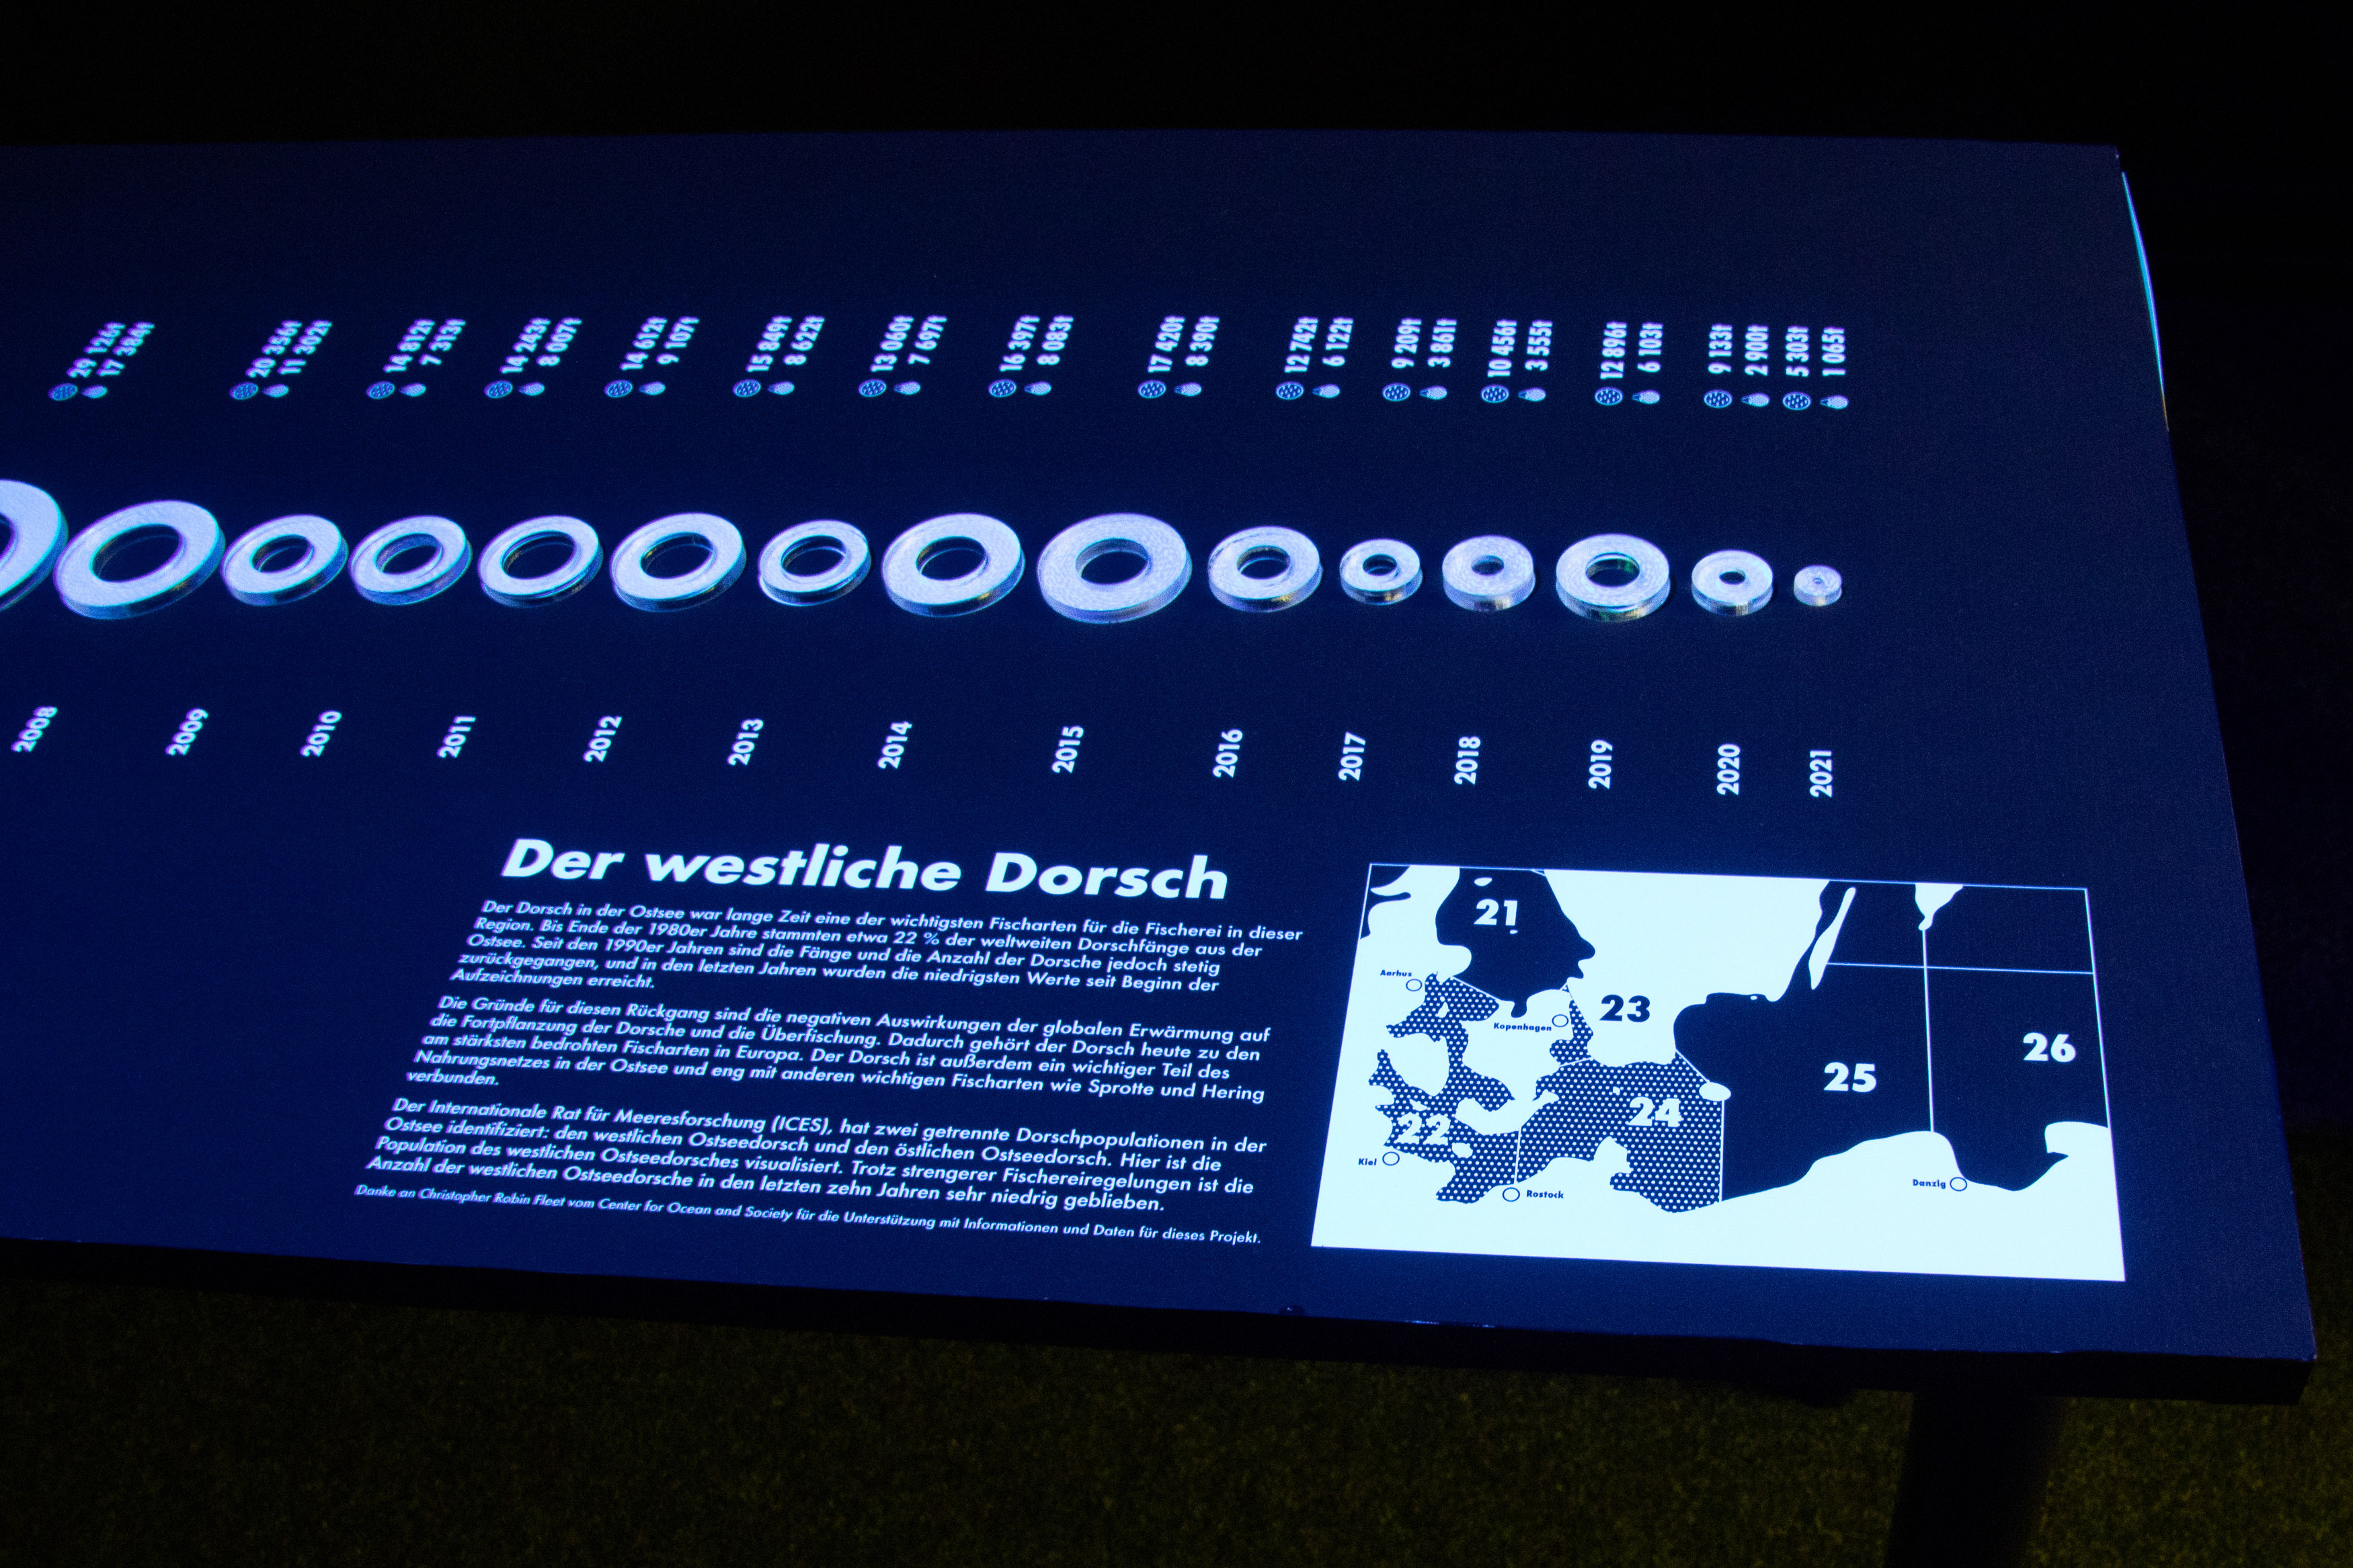
Life in northern Germany is closely linked to the Baltic Sea. Fishing and seafood are deeply rooted in the local culture, but the sea is increasingly affected by climate change and human activity. Most of the fish sold on the German coast no longer comes from nearby waters. Fish that are popular for human consumption, such as cod, have been heavily overfished for decades and driven to near extinction. This project aims to raise awareness of the urgent need to rethink our relationship with the ocean.
Project Description:
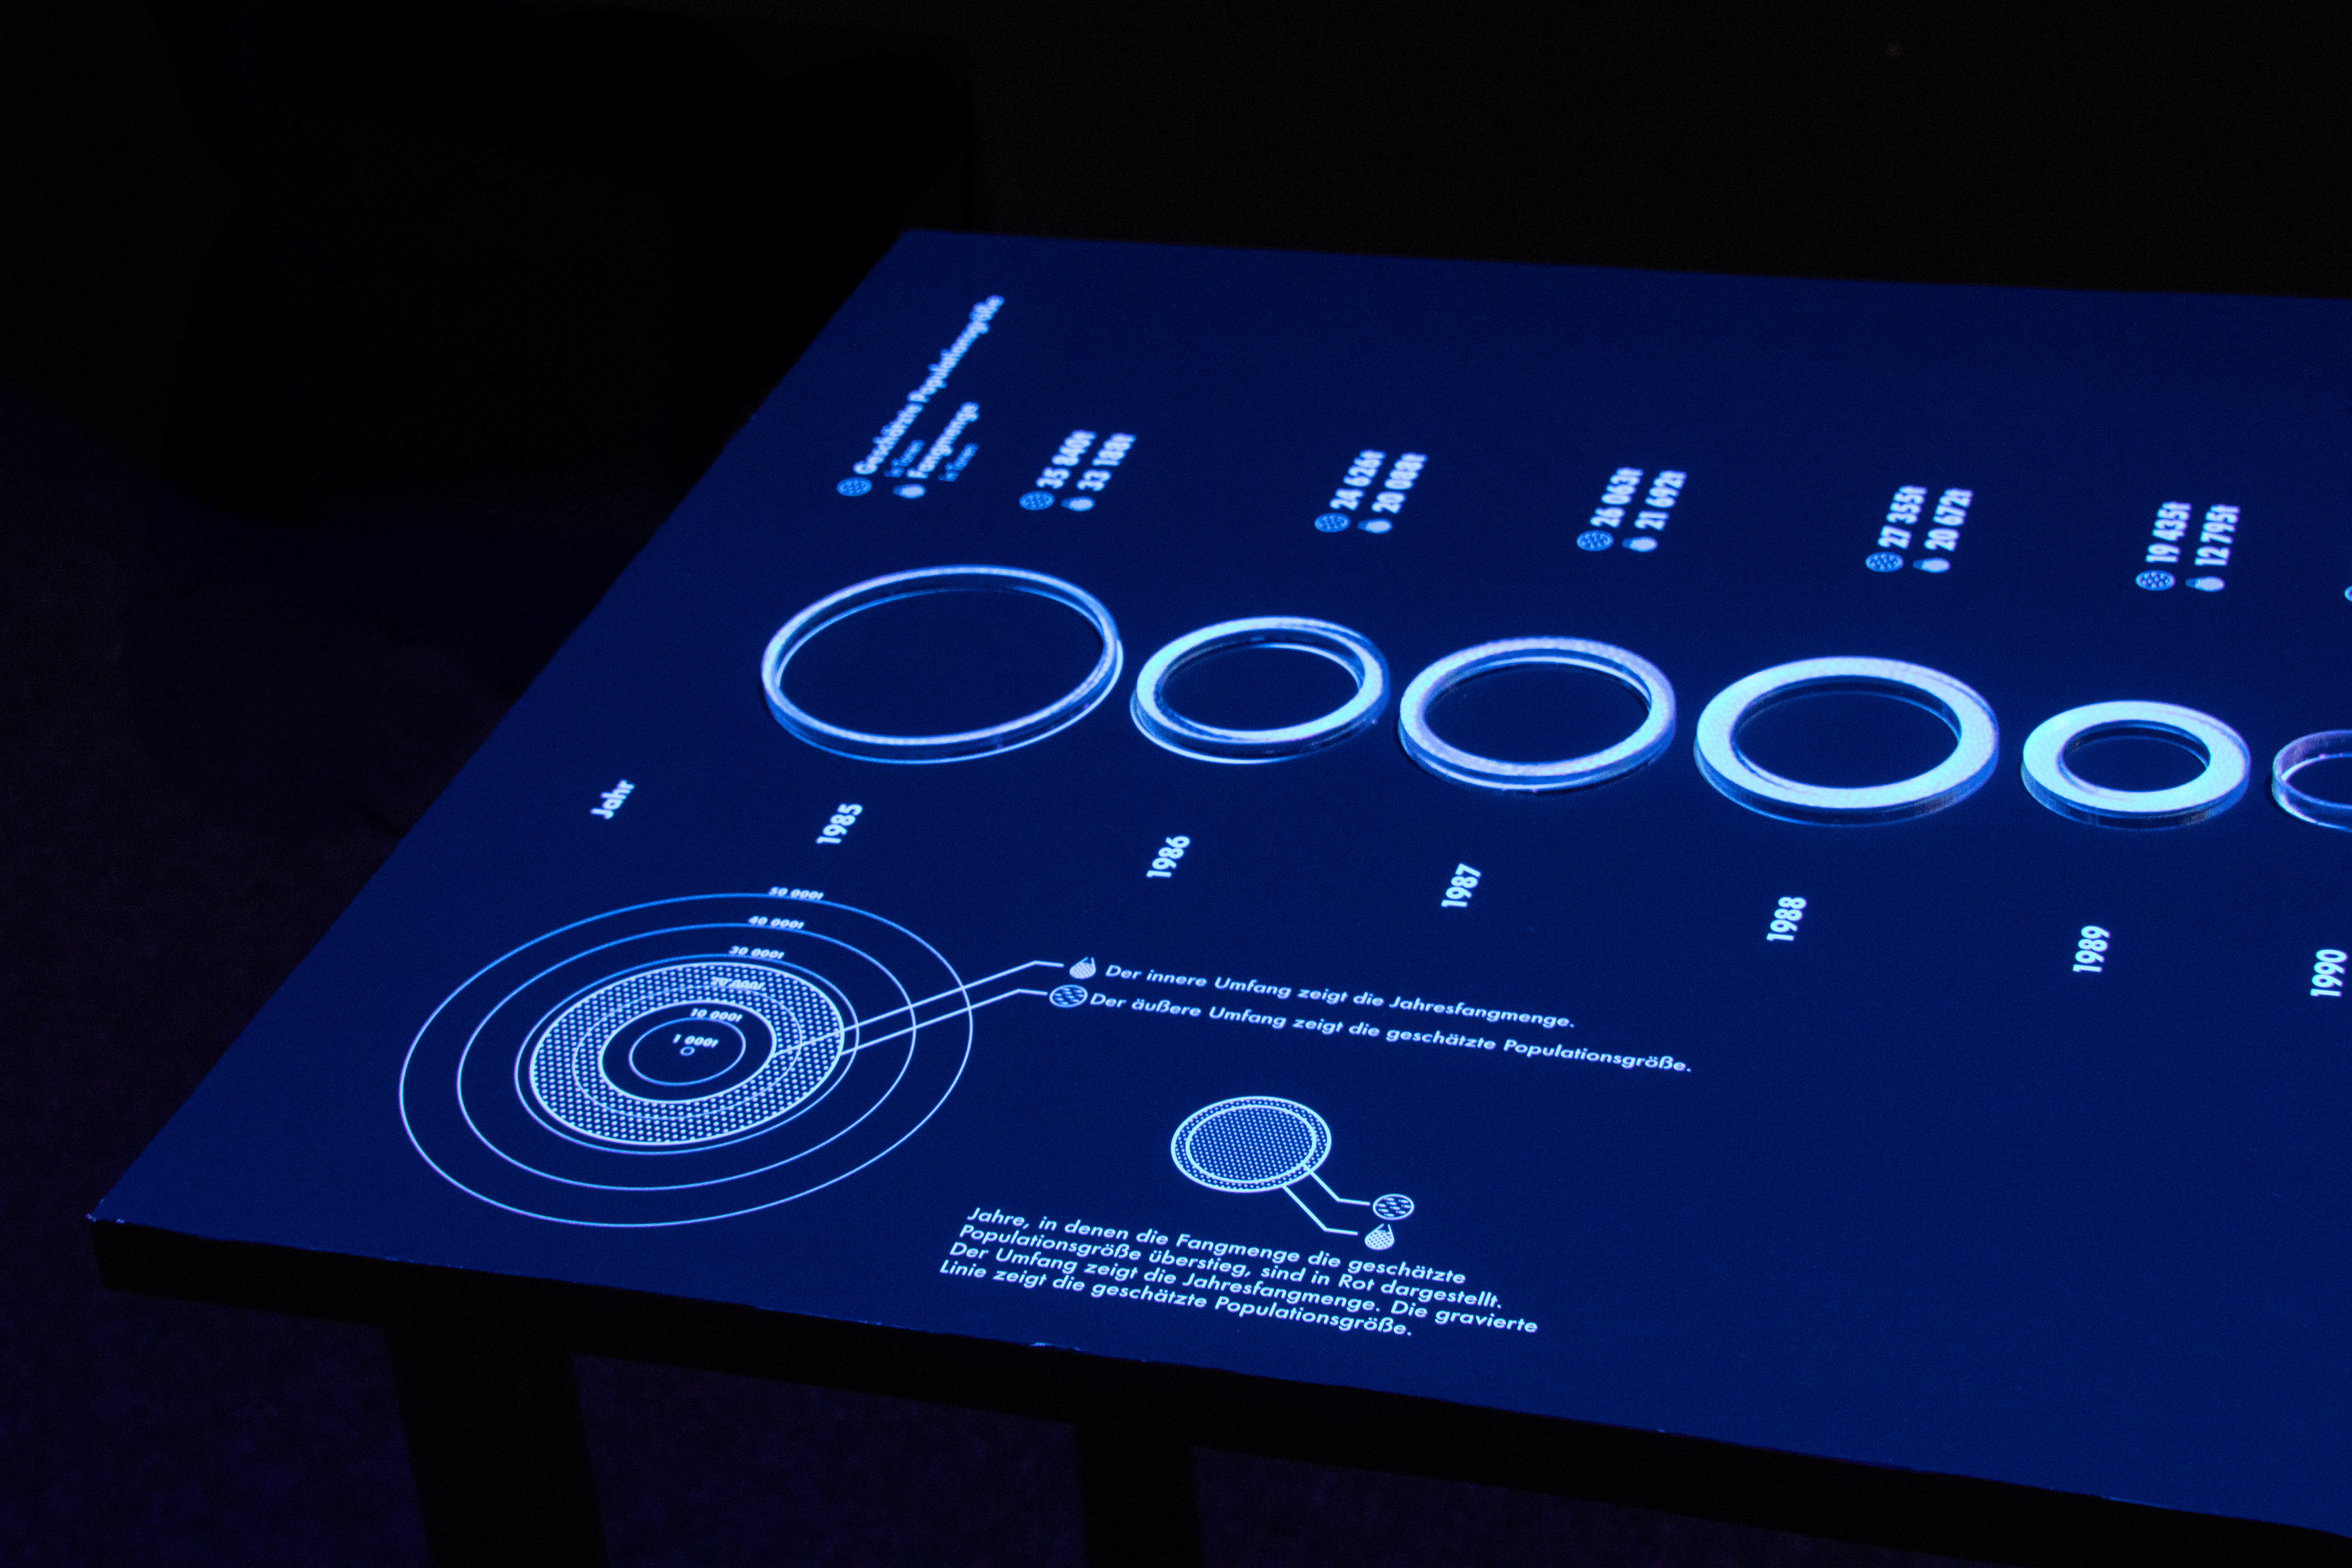
The sculpture visualises data on cod population and landing in the Western Baltic Sea from 1985 to 2021, using data from the International Council for the Exploration of the Sea (ICES) report of 2022. Data for subdivision 22-24, the Western Baltic stock, have been used as these are the waters adjacent to the German coast. The spawning stock biomass (SSB) was used to estimate the population. This estimate only includes adult fish that are able to reproduce and is therefore the most accurate estimate of a population's ability to survive.
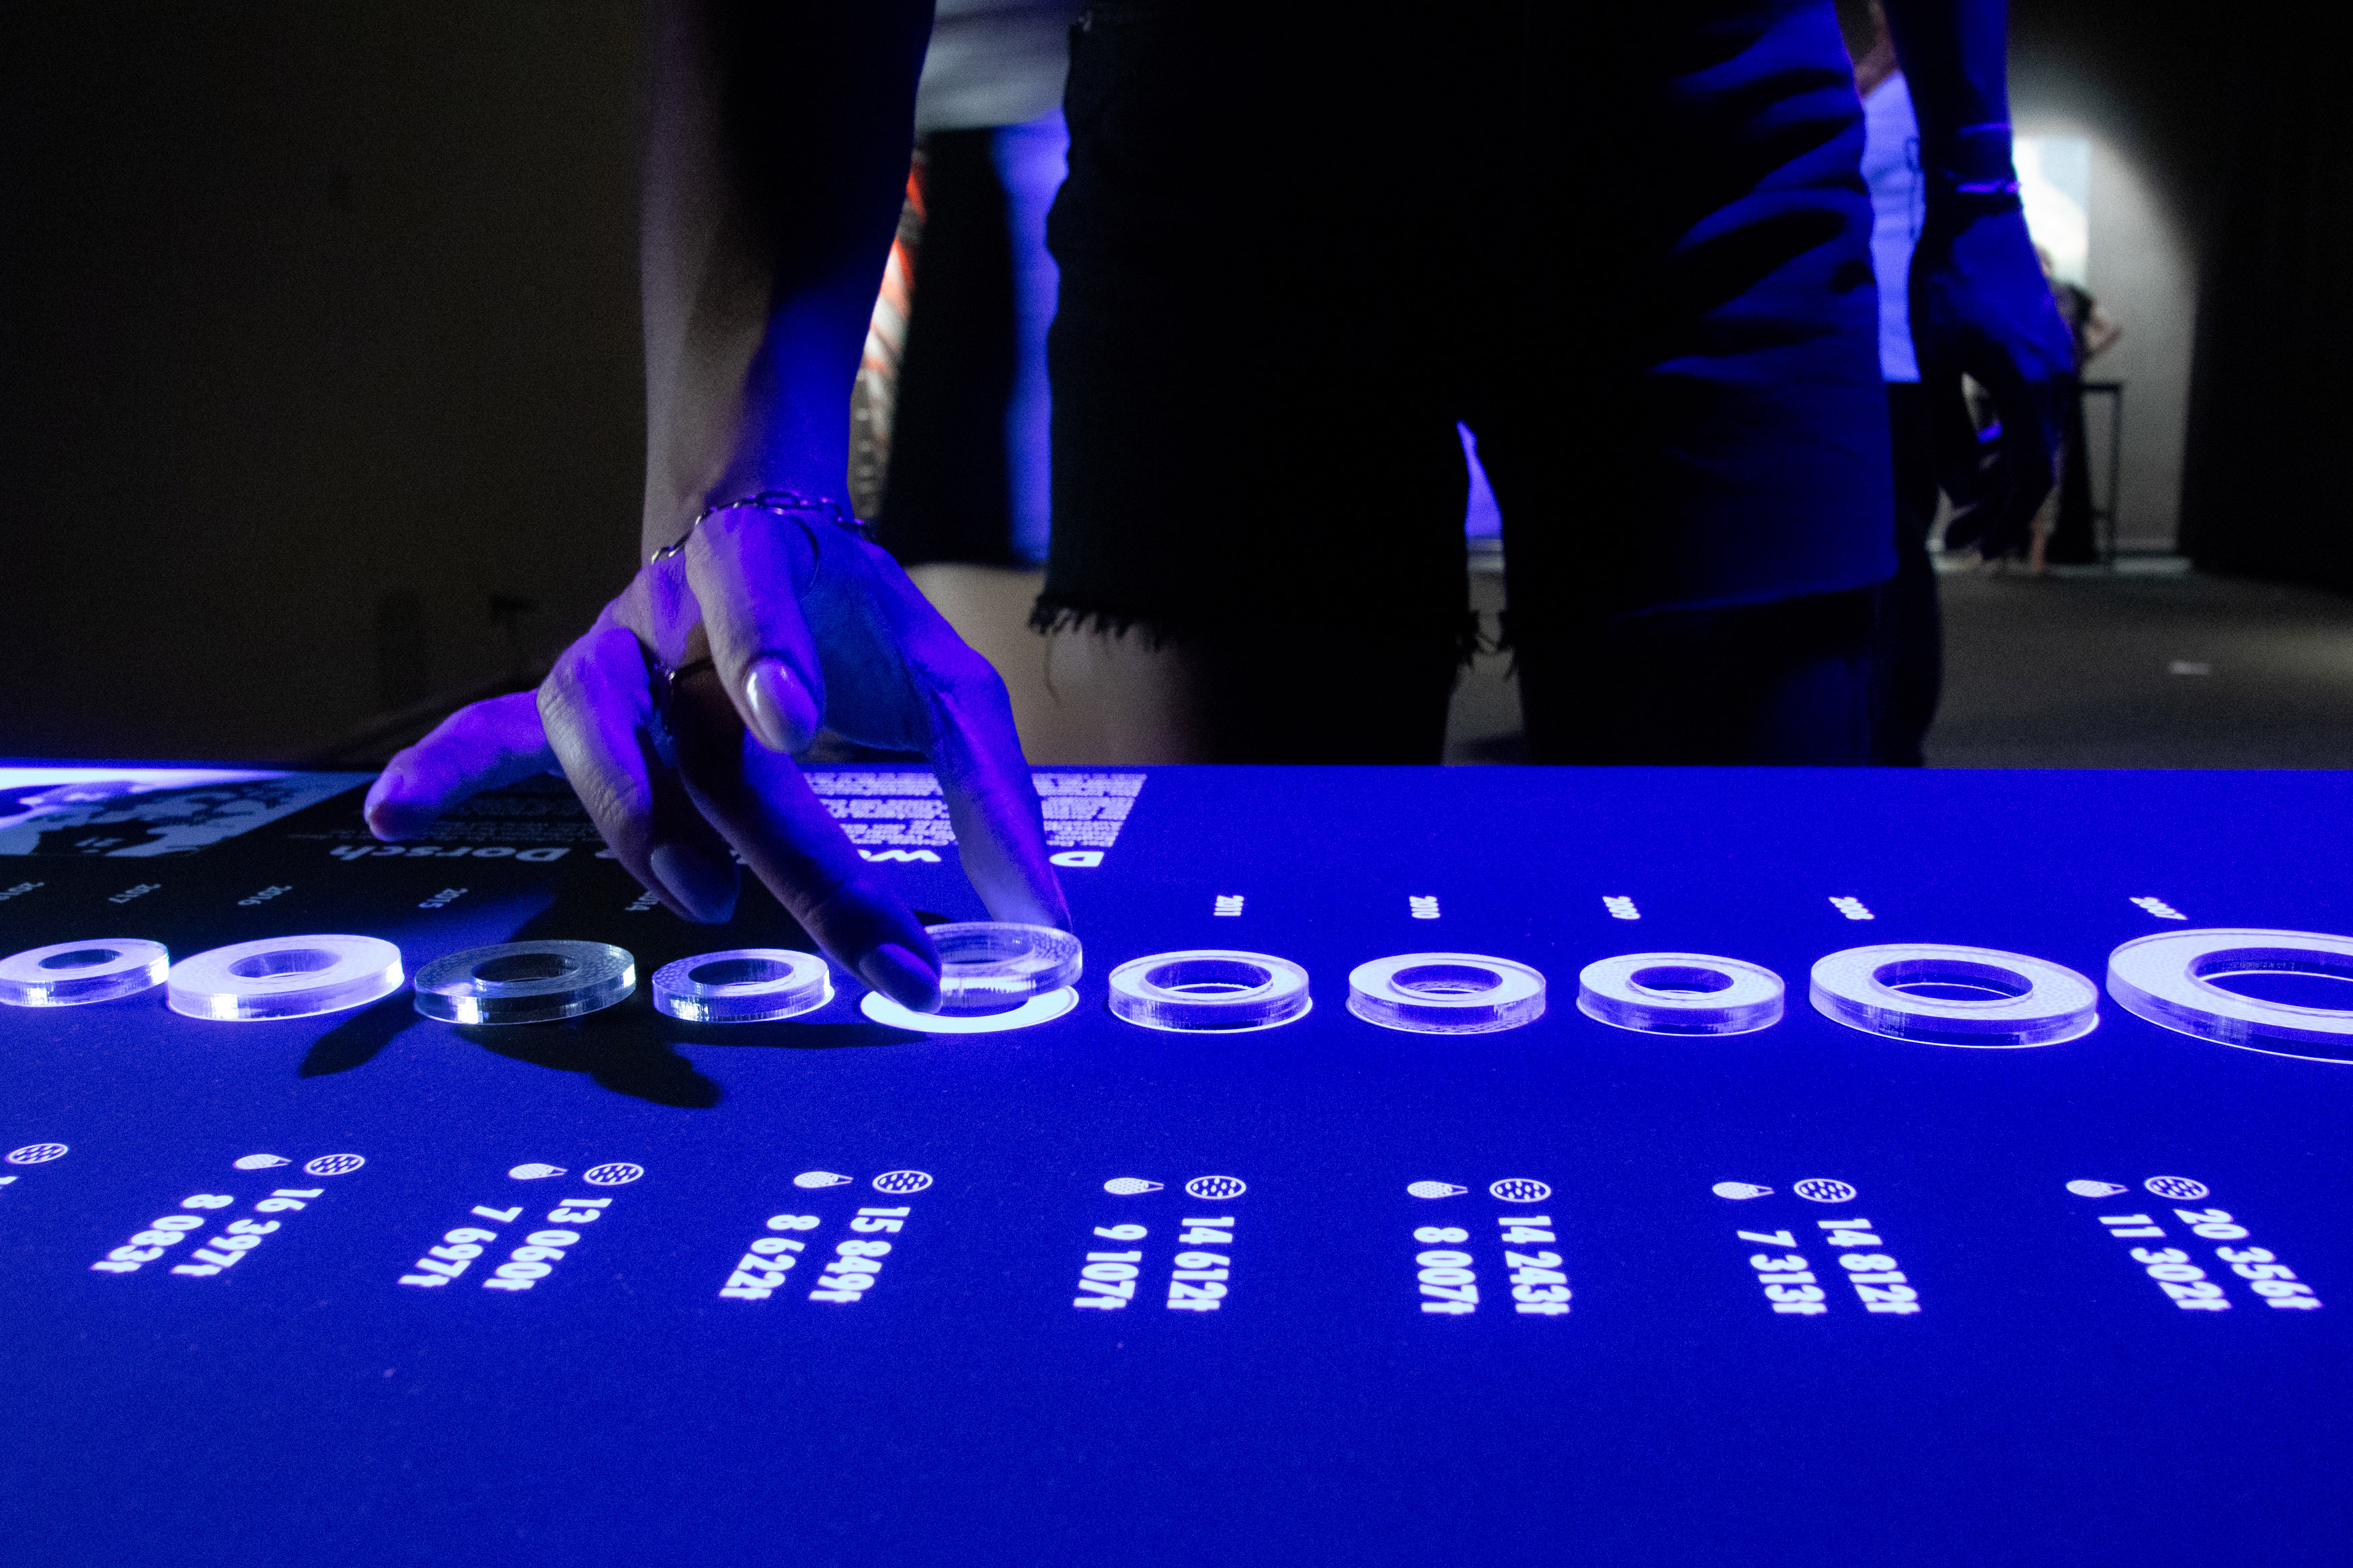
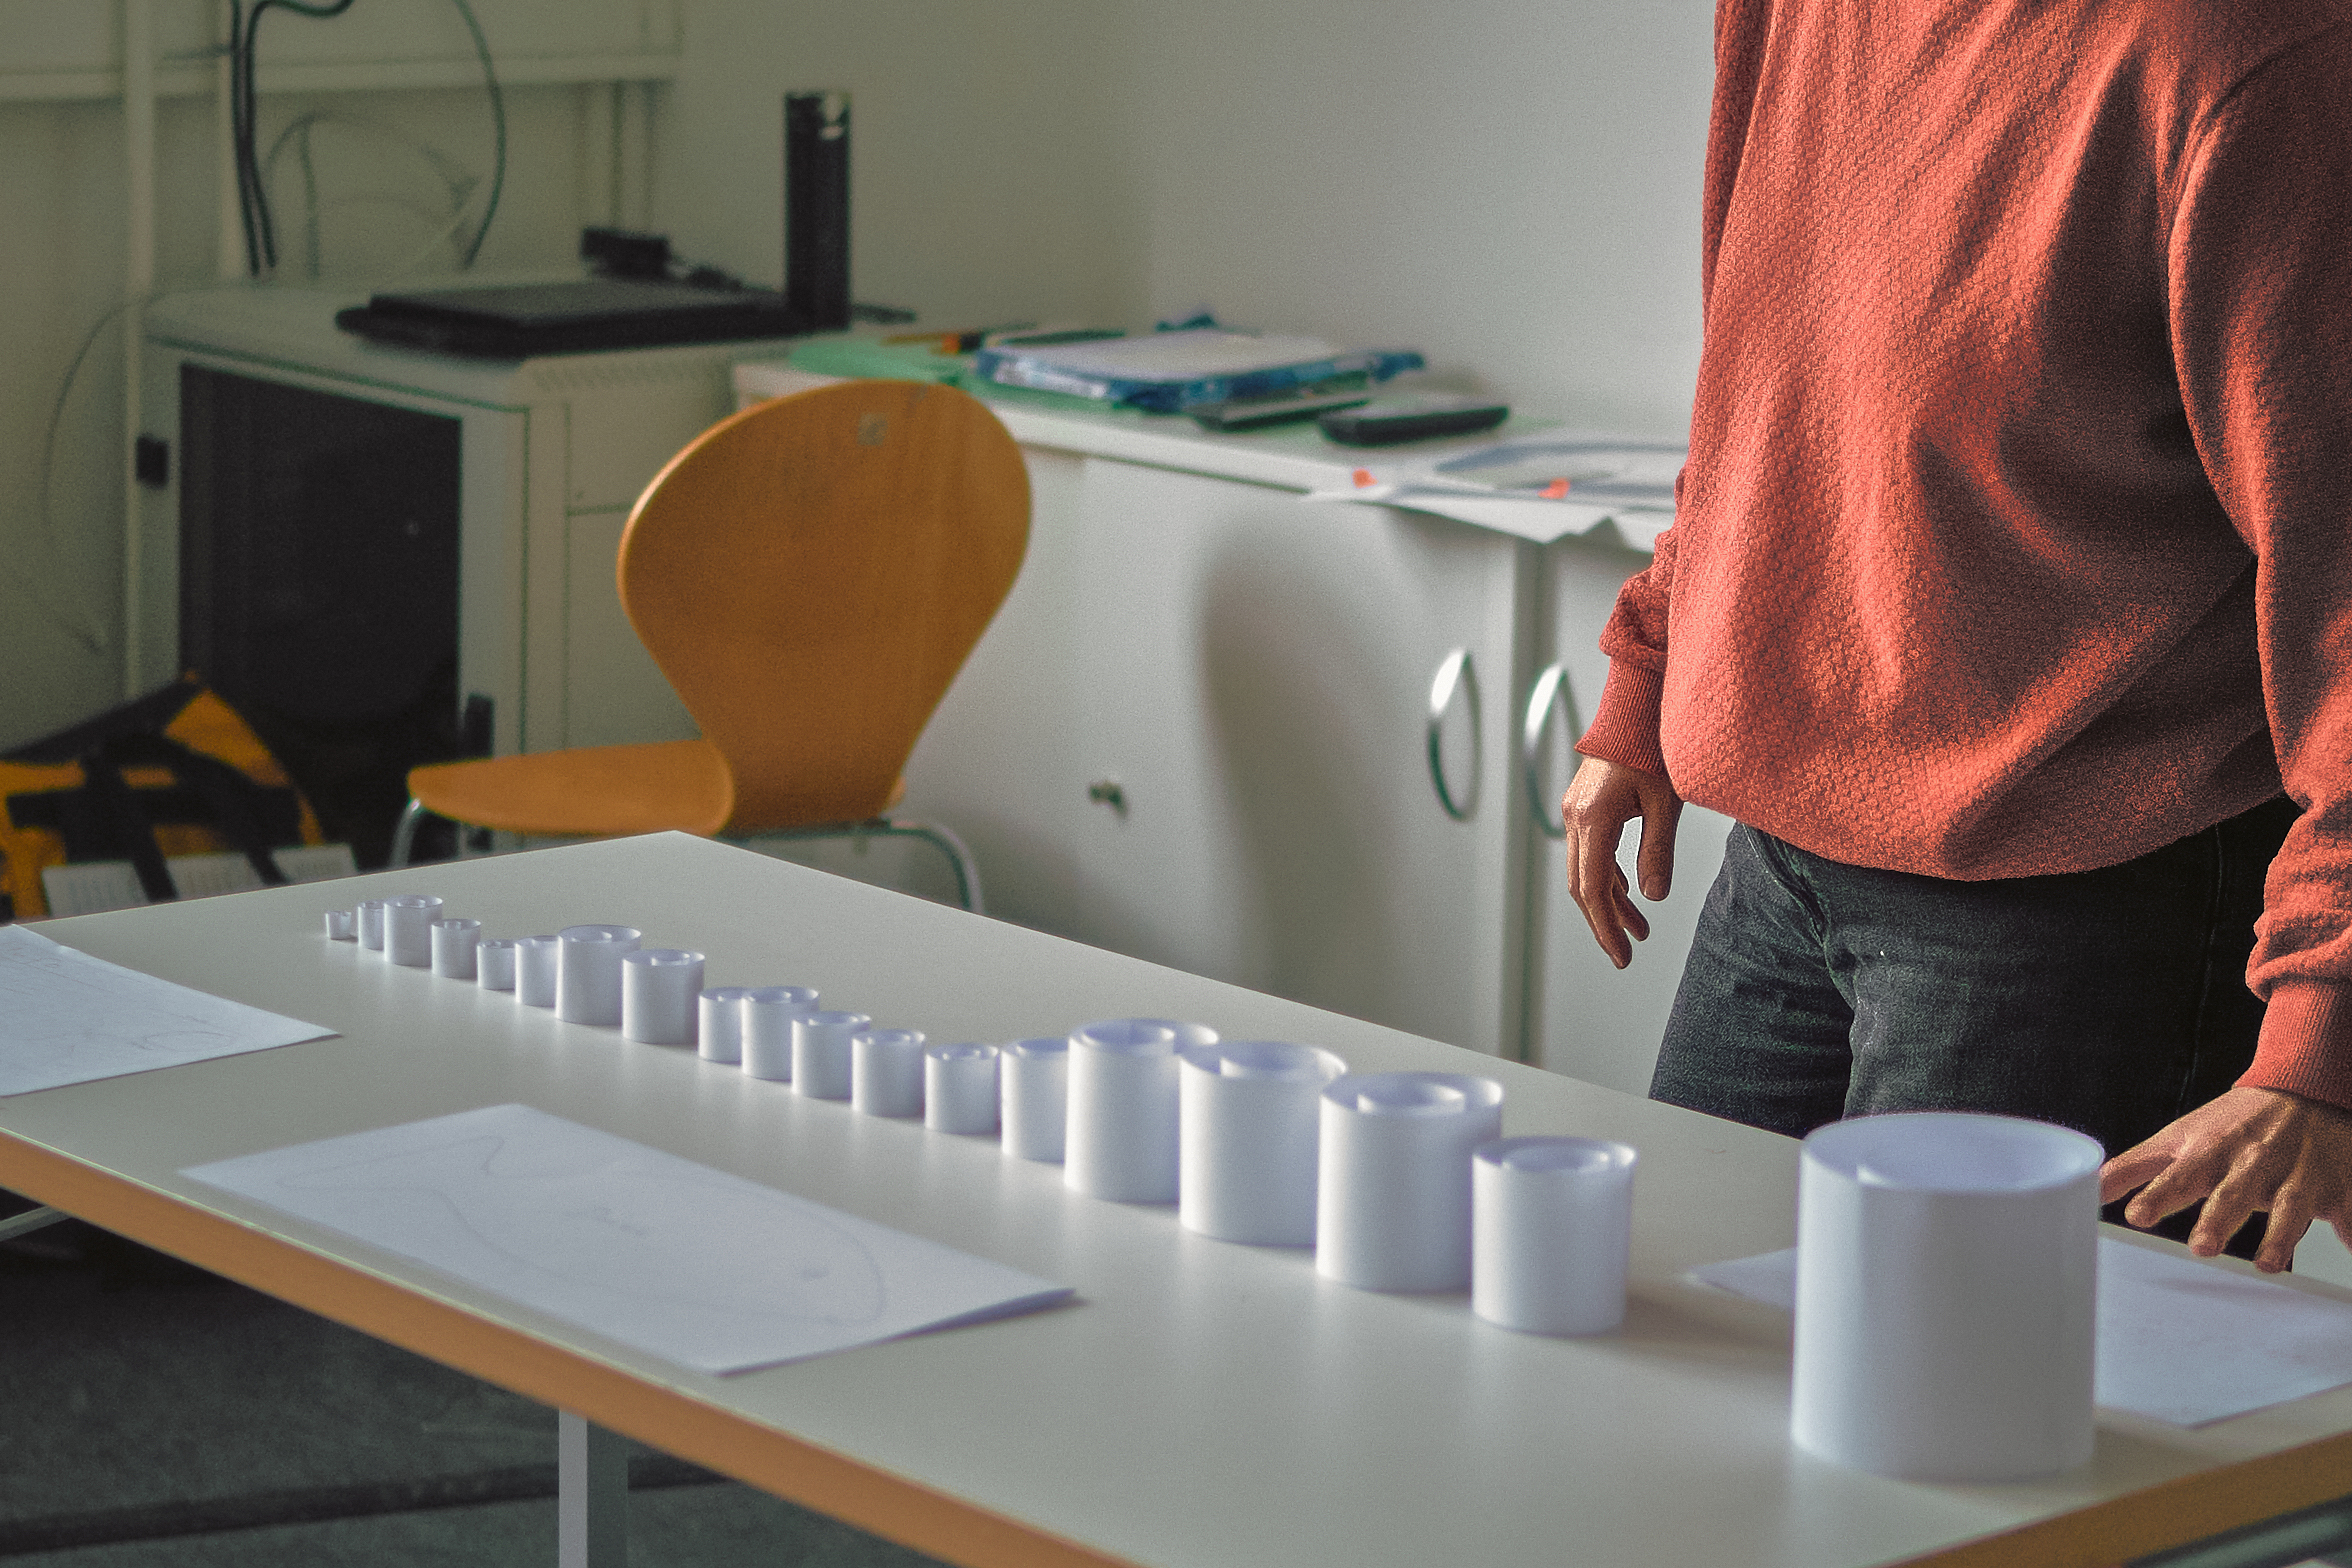
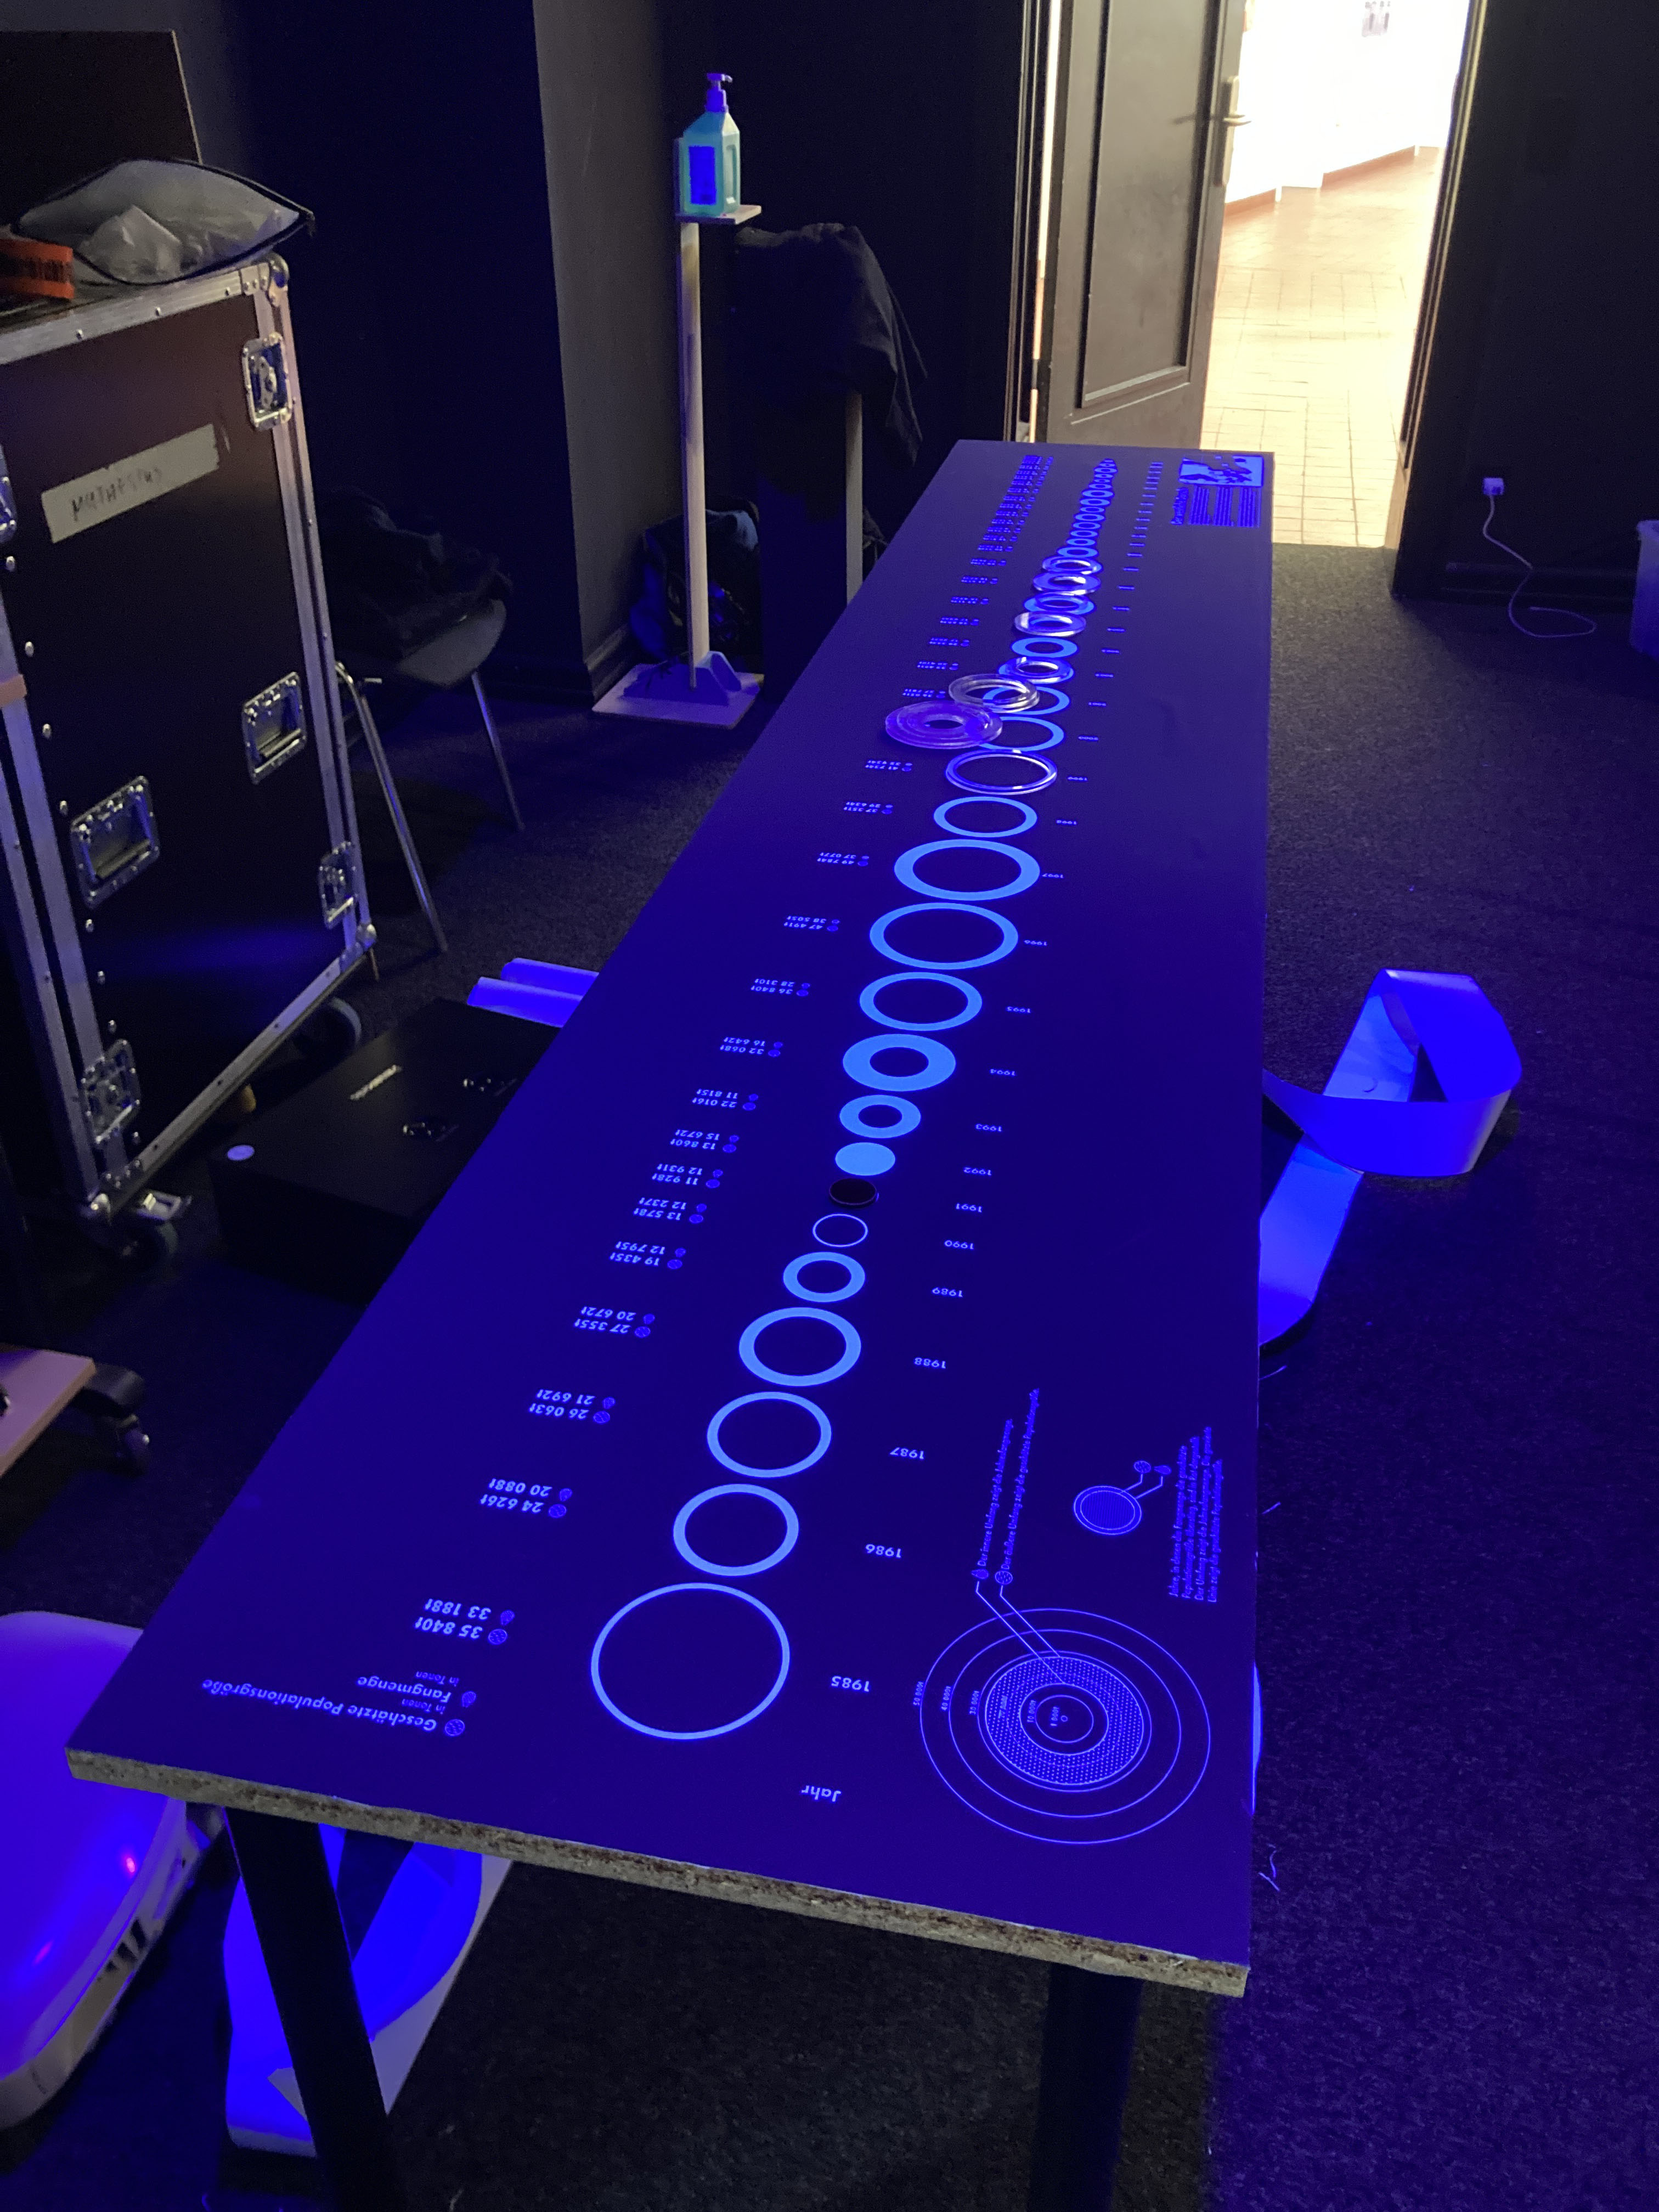
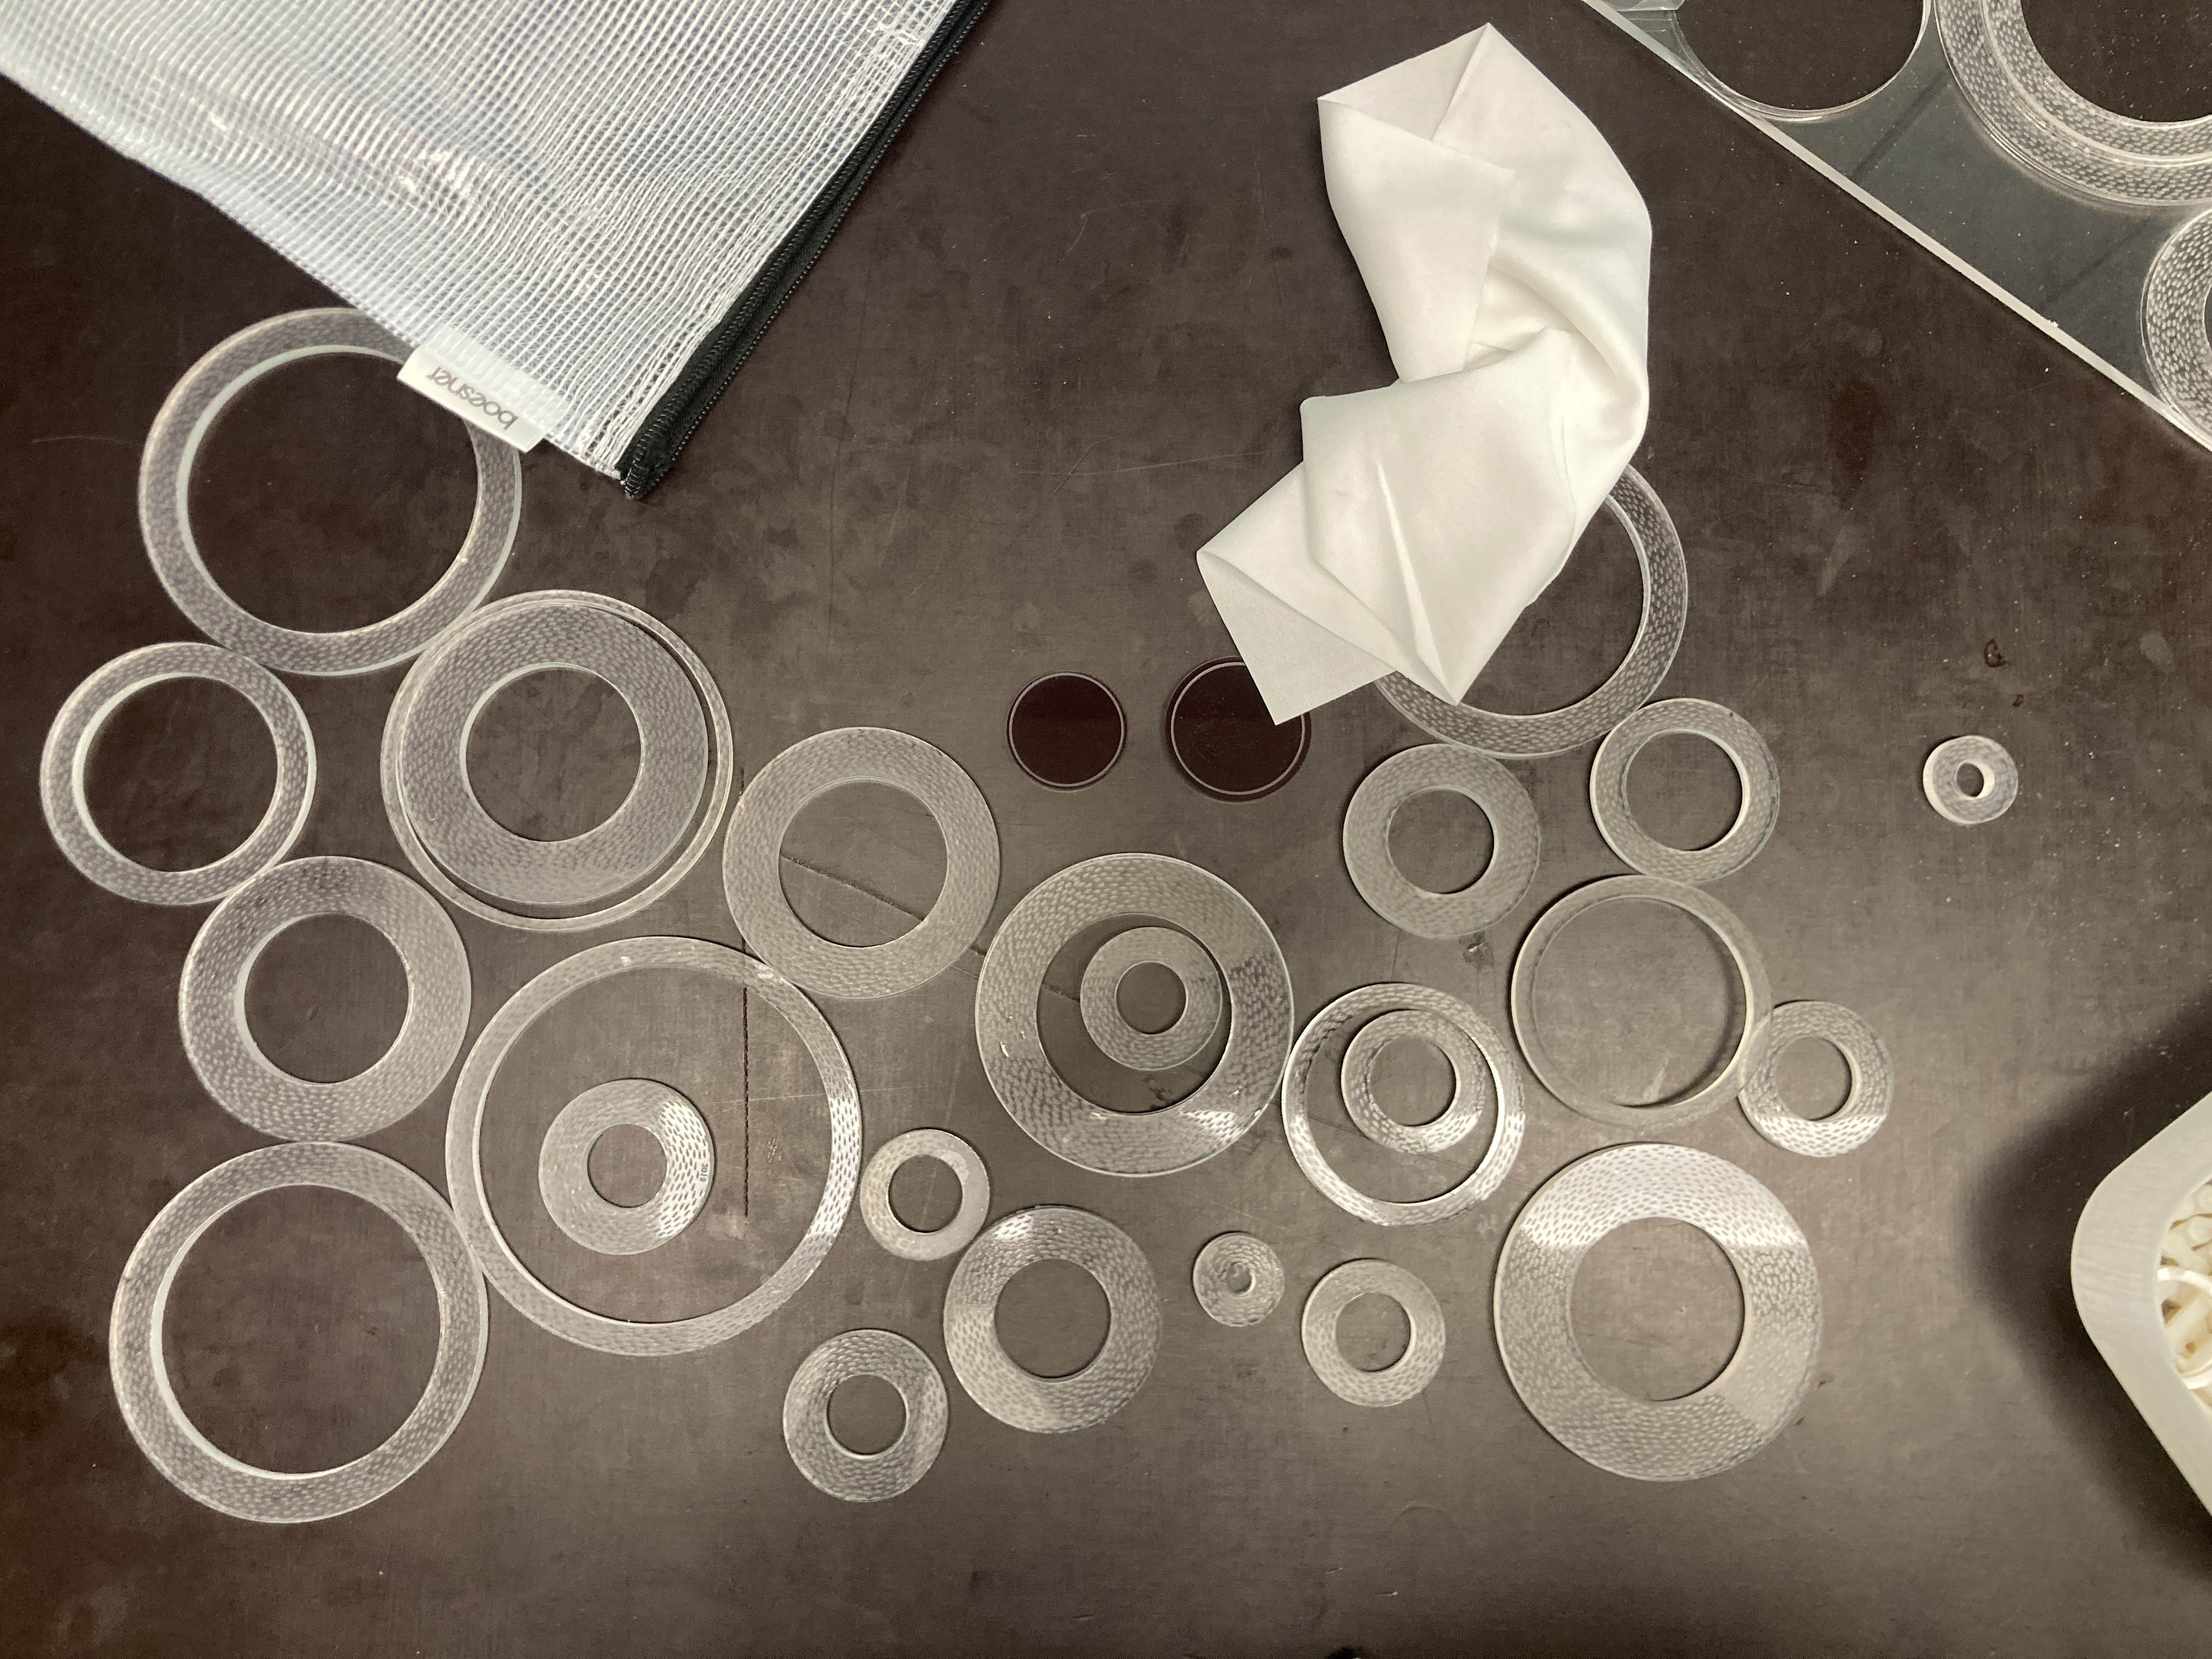
The objects are placed on the timeline on the table, with the index, introductory text and a map printed on it. I choose a dark background to give the rings an otherworldly glow under black light. The rings are not fixed to the table. Visitors can pick them up, examine them and move them around for comparison.
The outer diameter represents the estimated size of the population and the inner diameter (the circle cut out) represents the landings. Each ring represents one year. I used a circular shape to resemble a school of fish circling. In two years the landings were higher than the estimated population size. I decided to represent these years as dark red circles with an engraved line. The line represents the estimated population size.
I chose to focus on overfishing in this project because it is a direct result of human intervention in the ocean. However, other factors such as rising water temperatures and oxygen depletion due to climate change are also likely to be affecting the cod population.