The Energy of Data
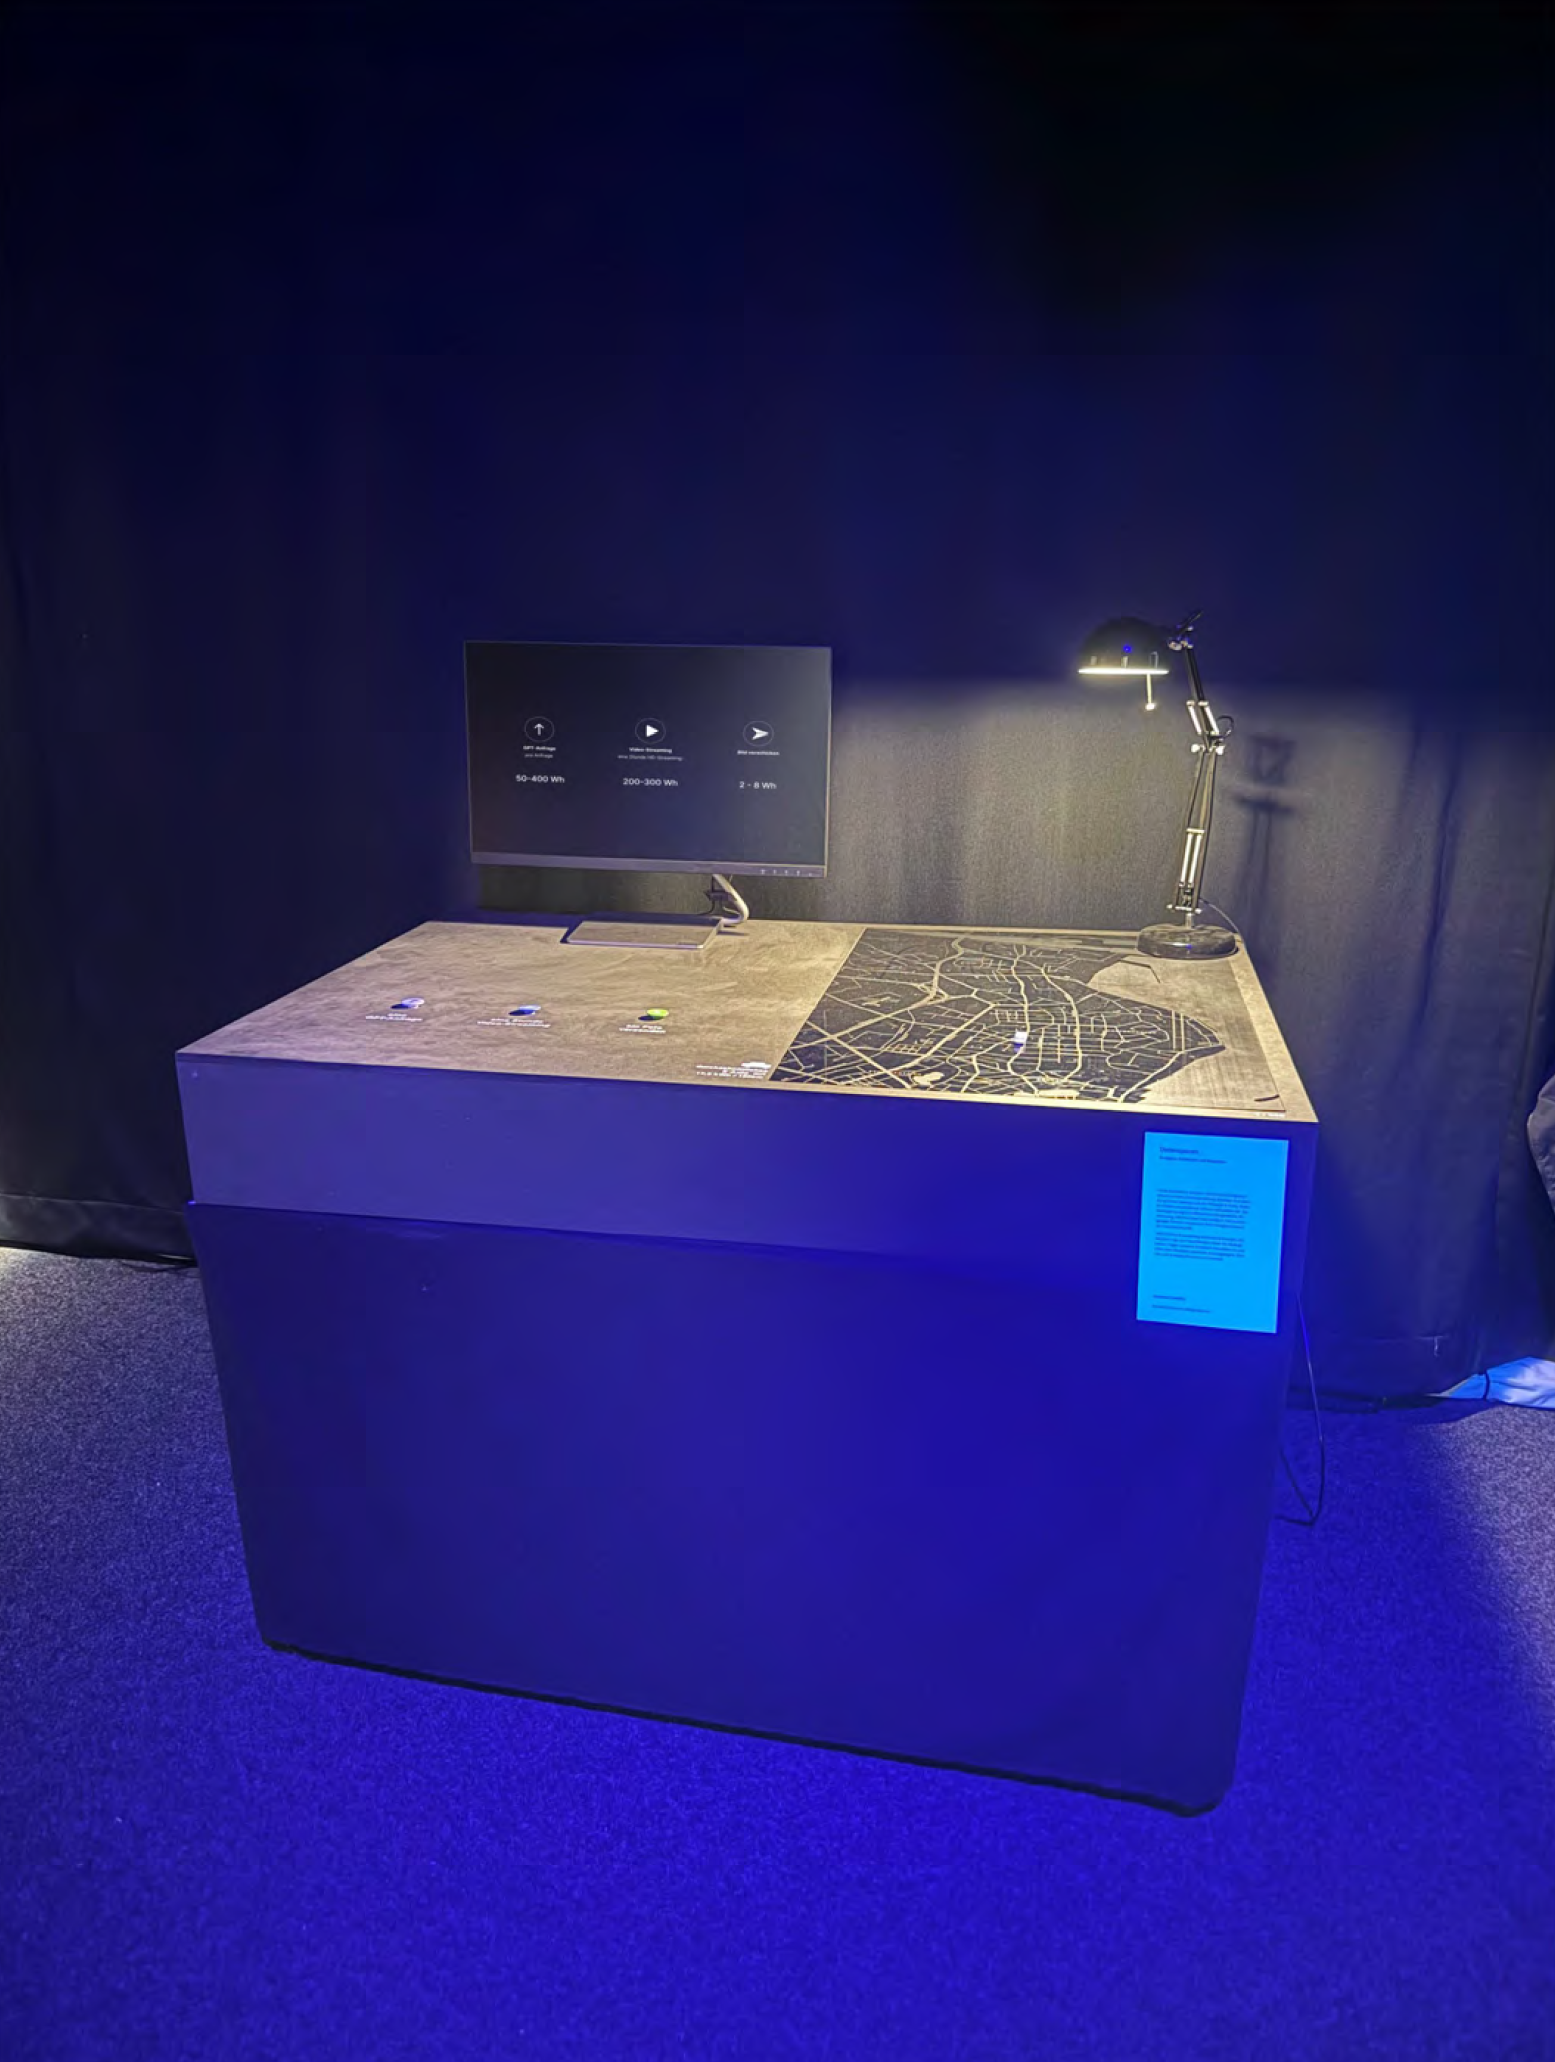
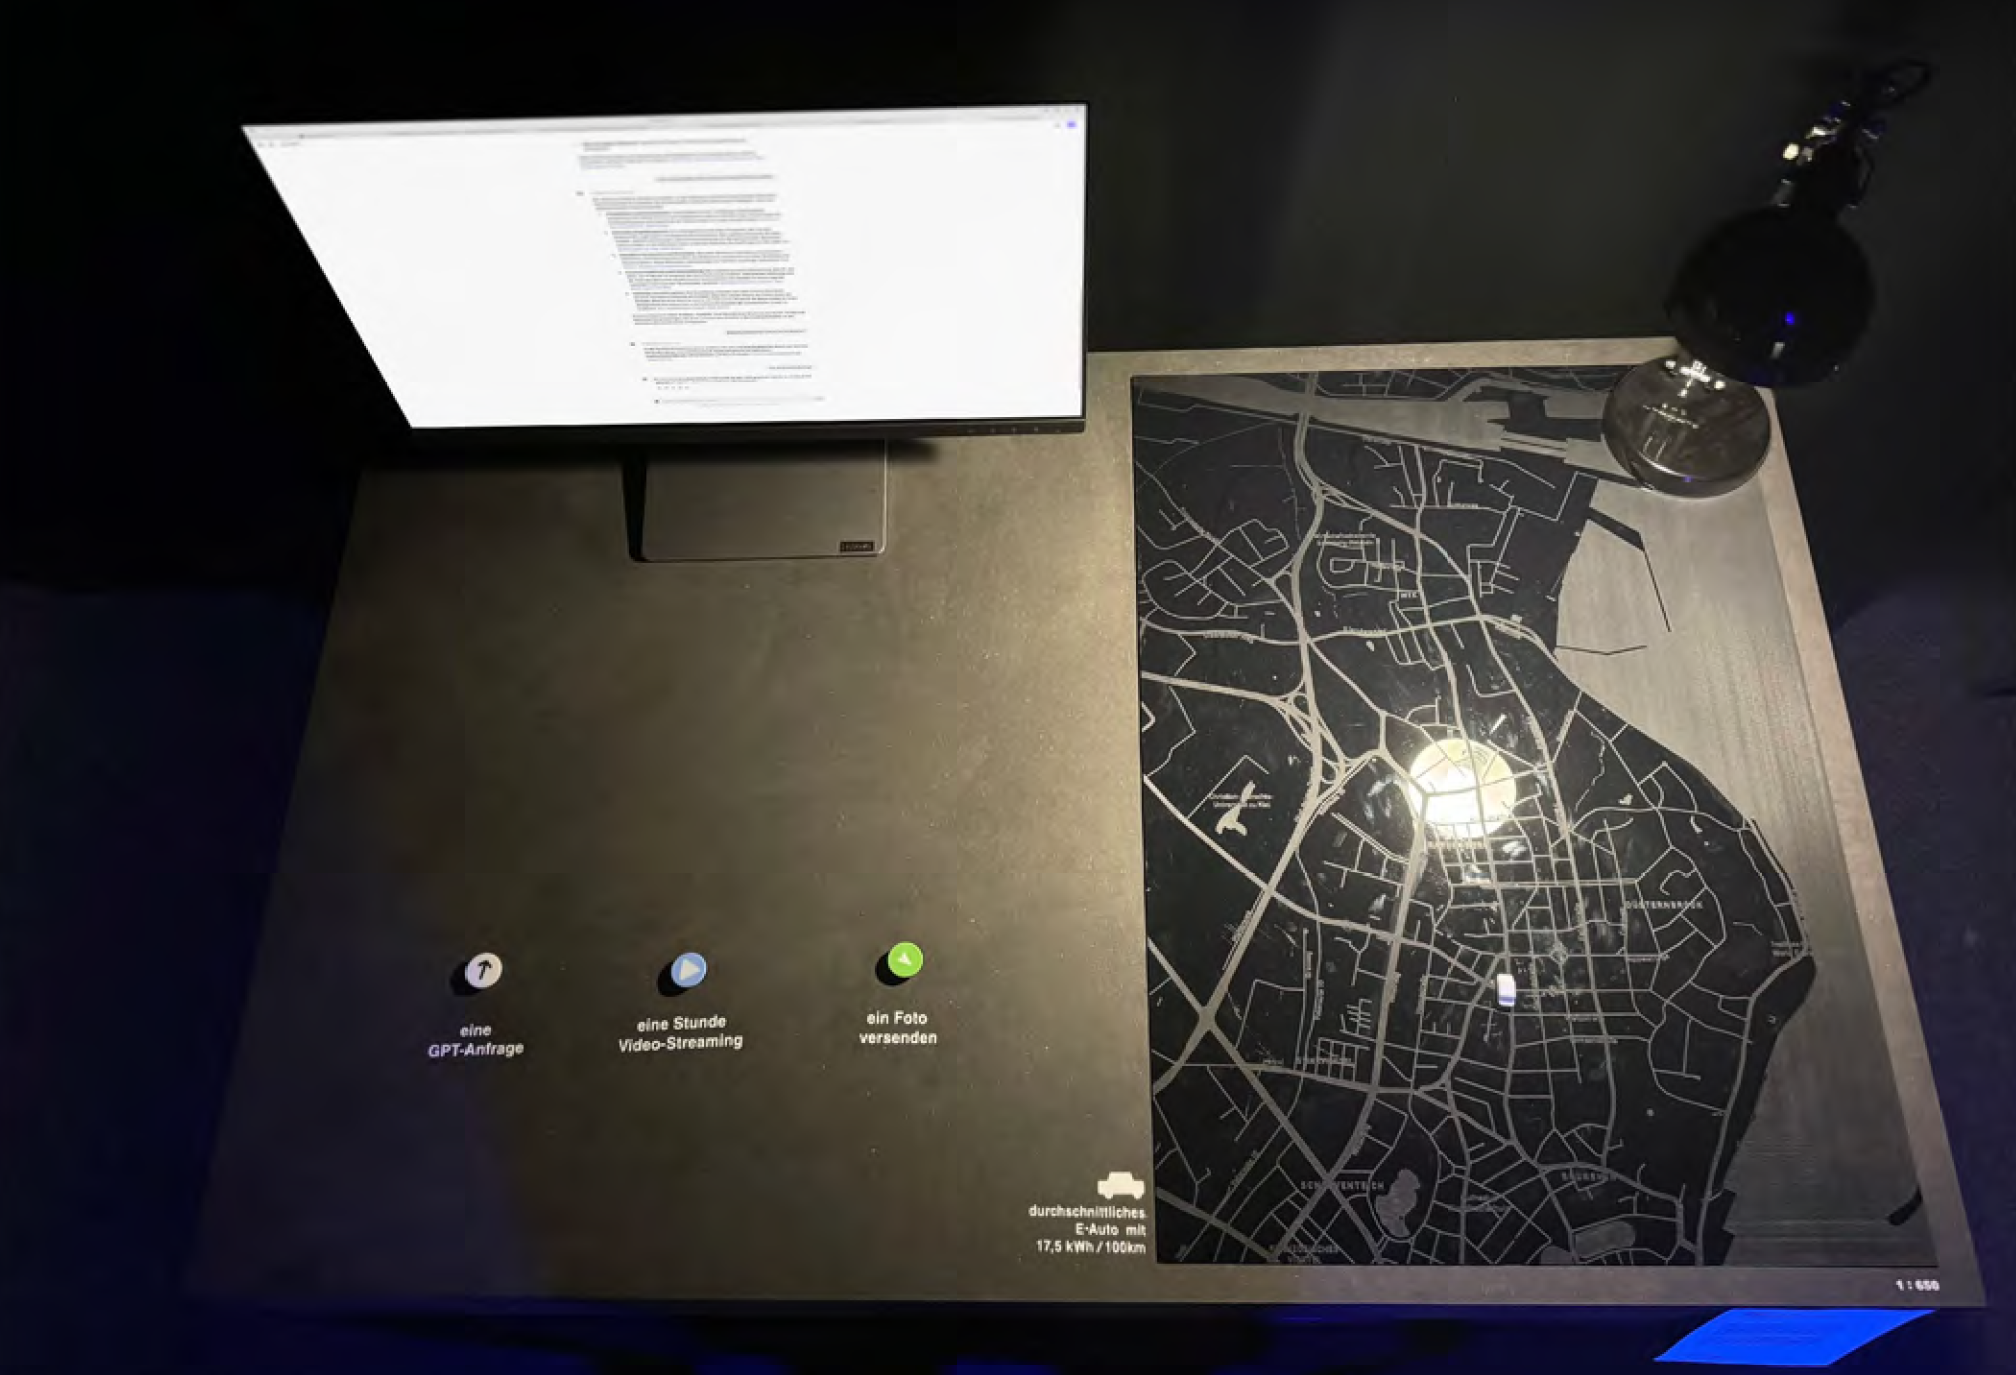
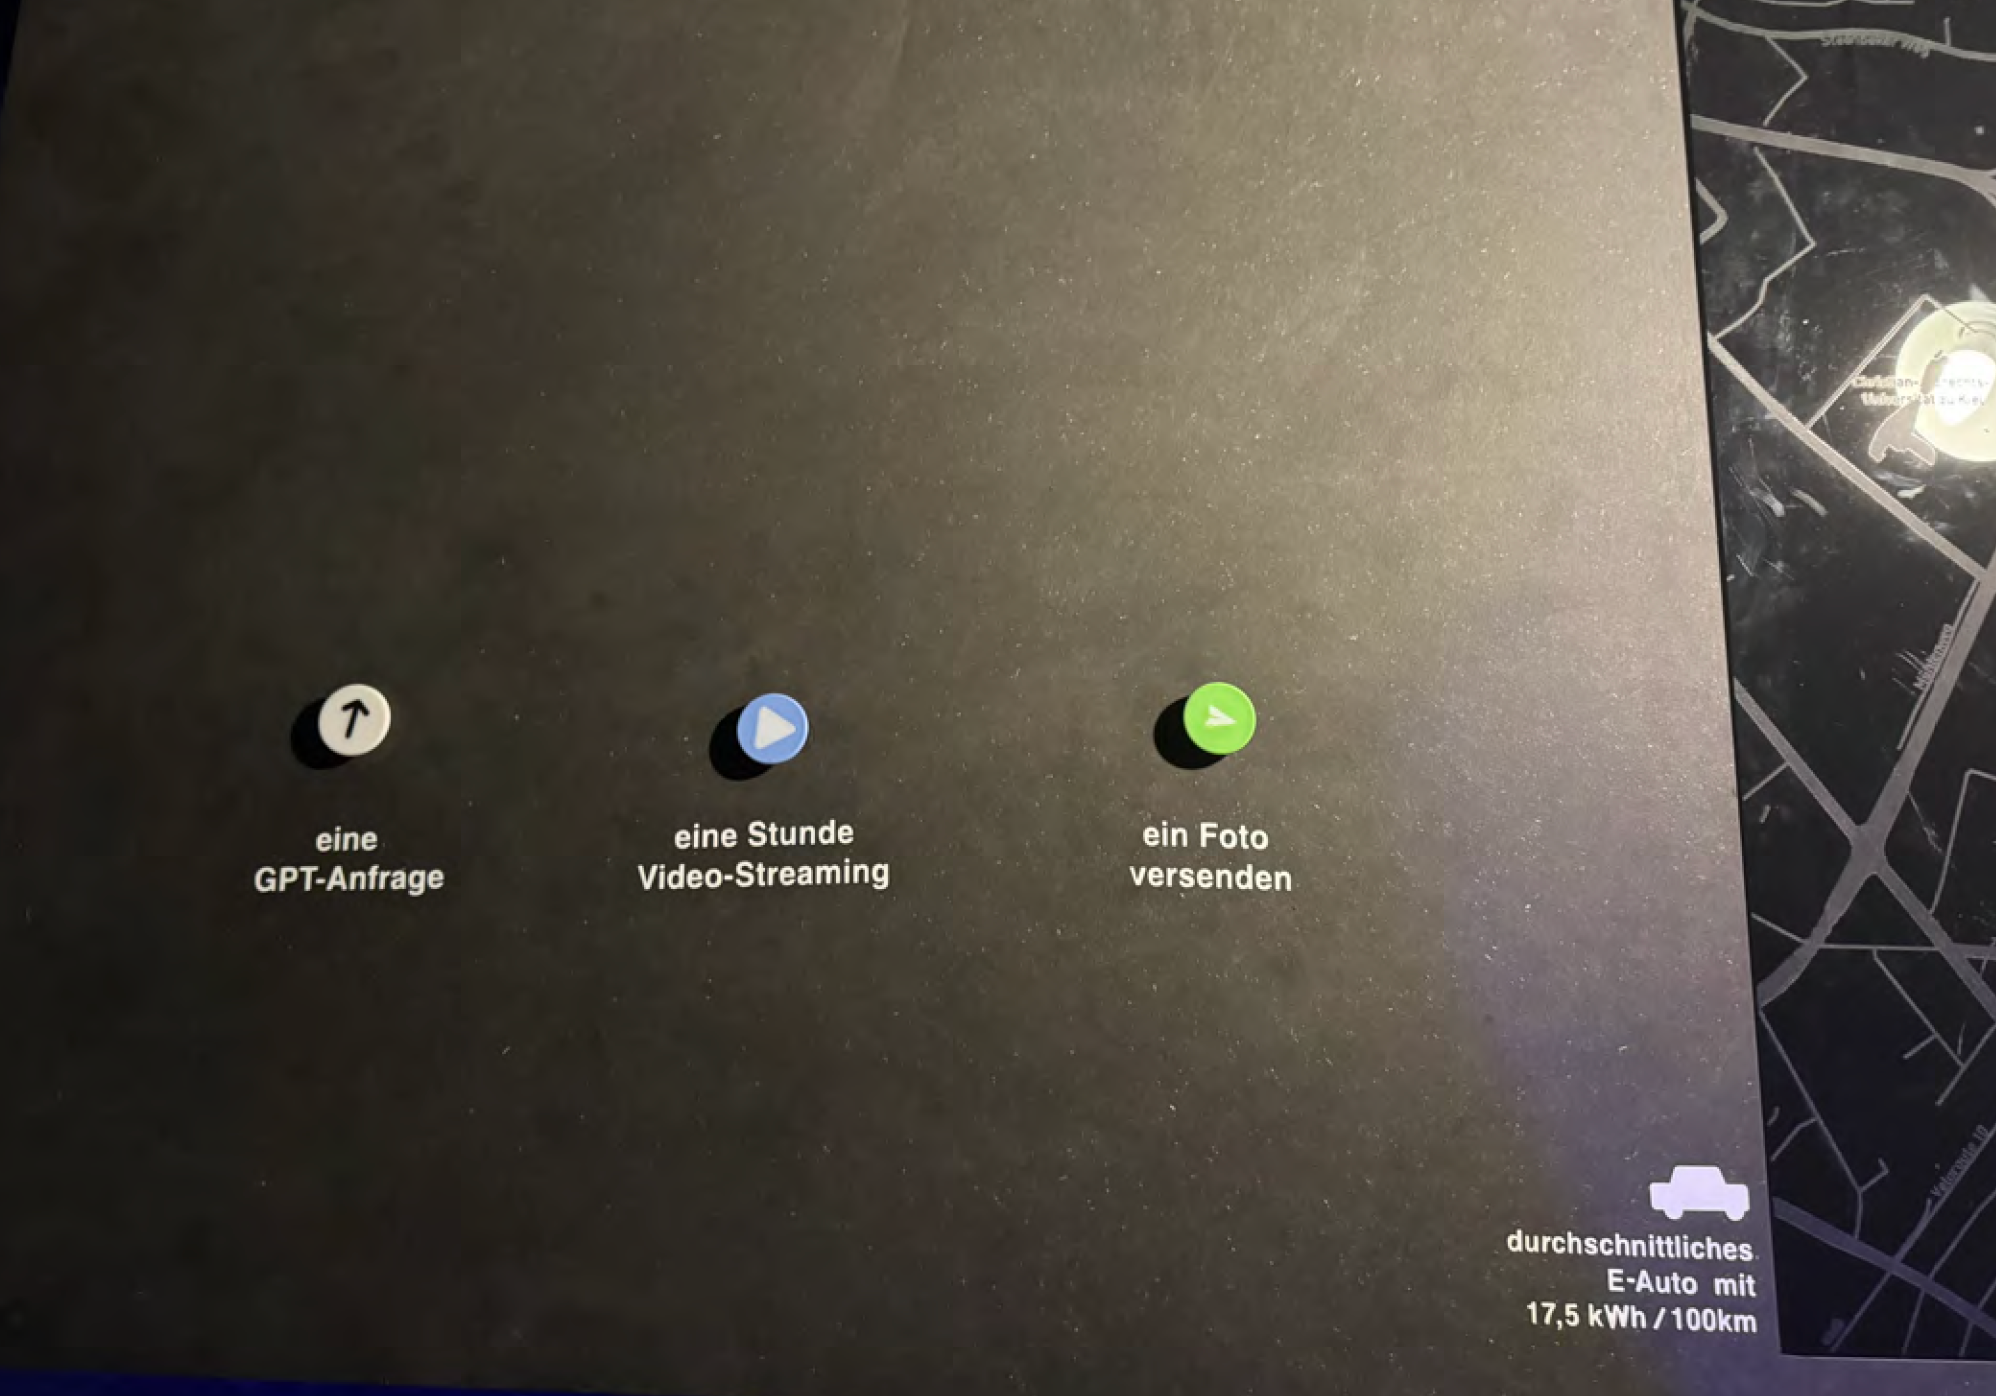
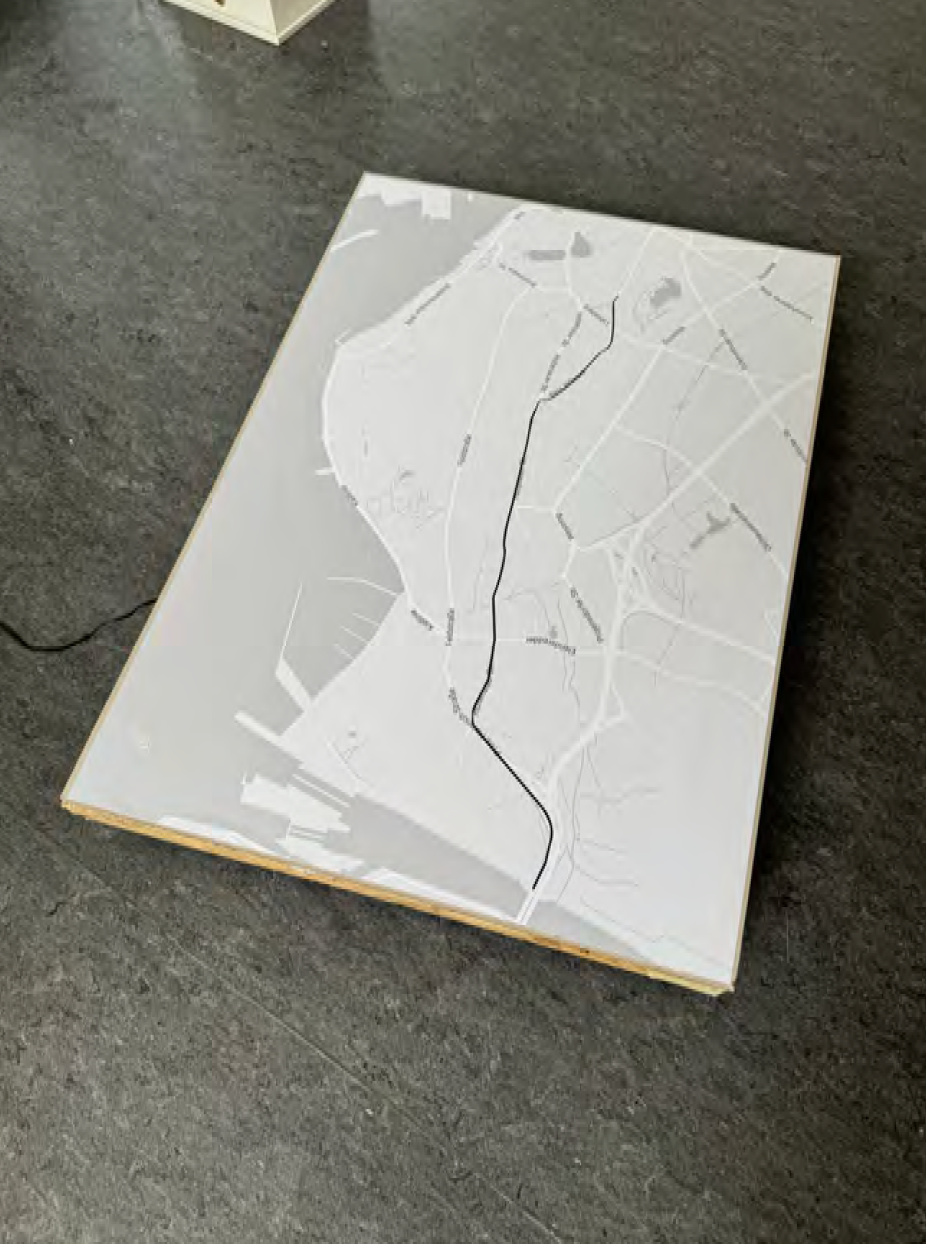
This interactive sculpture visualizes the energy consumption of internet activities using a moving miniature electric car on an acrylic map, encoding data on energy use for activities like streaming and LLM.
| Year | 2024 |
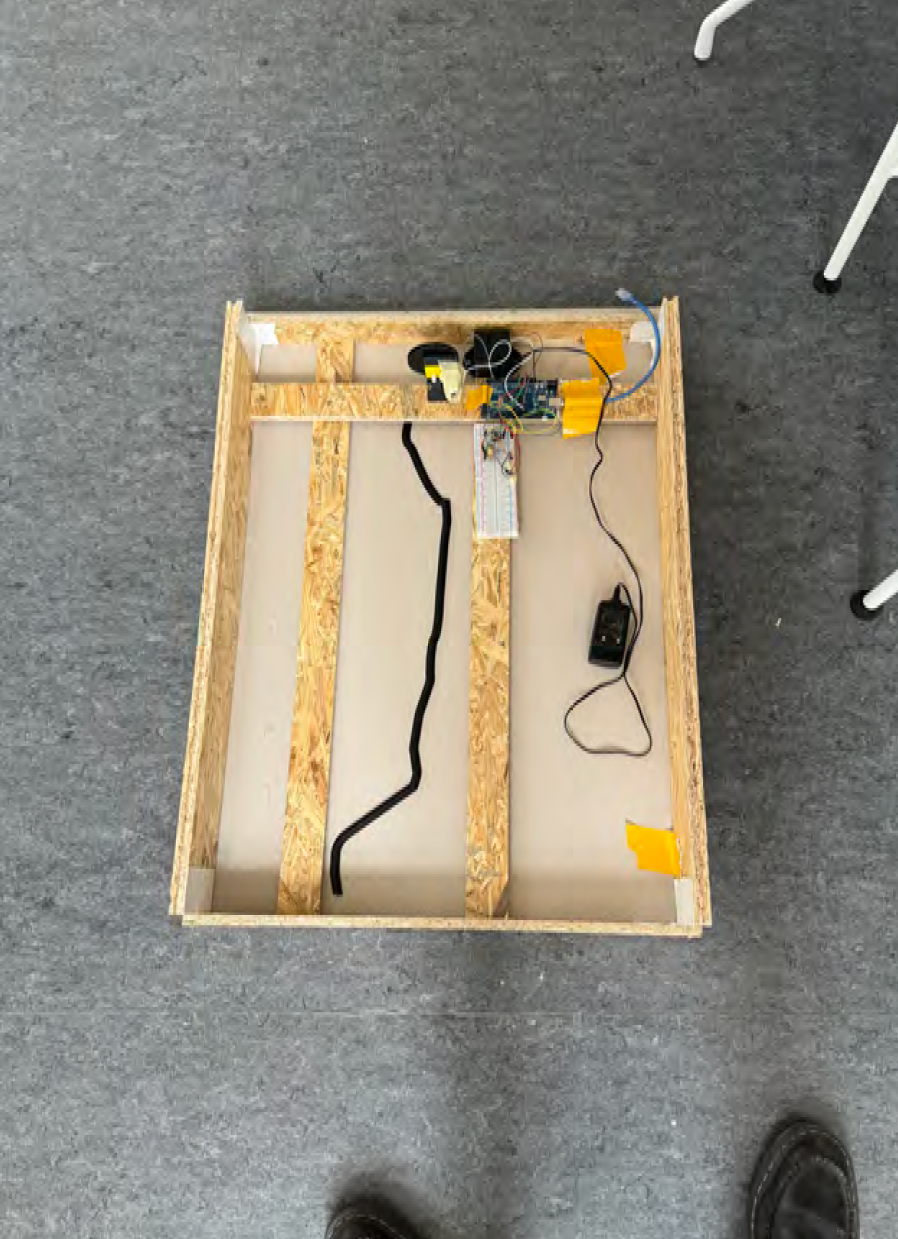
| Material | 3D-printed miniature Car, Acrylic, Arduino, Magnets, Fishing line |
| Production/Tools | 3D printer, Figma, SolidWorks, Laser-Engraving |


Motivation:
The rising energy consumption of the internet and its environmental impact inspired this sculpture. I wanted to make abstract data traffic tangible and provoke thought. A key insight driving this project is that much of the energy use in digital activities isn't visible to the user.
The sculpture bridges the tangible world of electric vehicles with the invisible energy demands of our digital activities, using a map and miniature car to visualize this connection. It's aimed at a broad audience often unaware of the true energy footprint of their online activities. The goal is to raise awareness about the unseen energy demands of our digital world and perhaps encourage more mindful use of technology.
Practices and Processes:
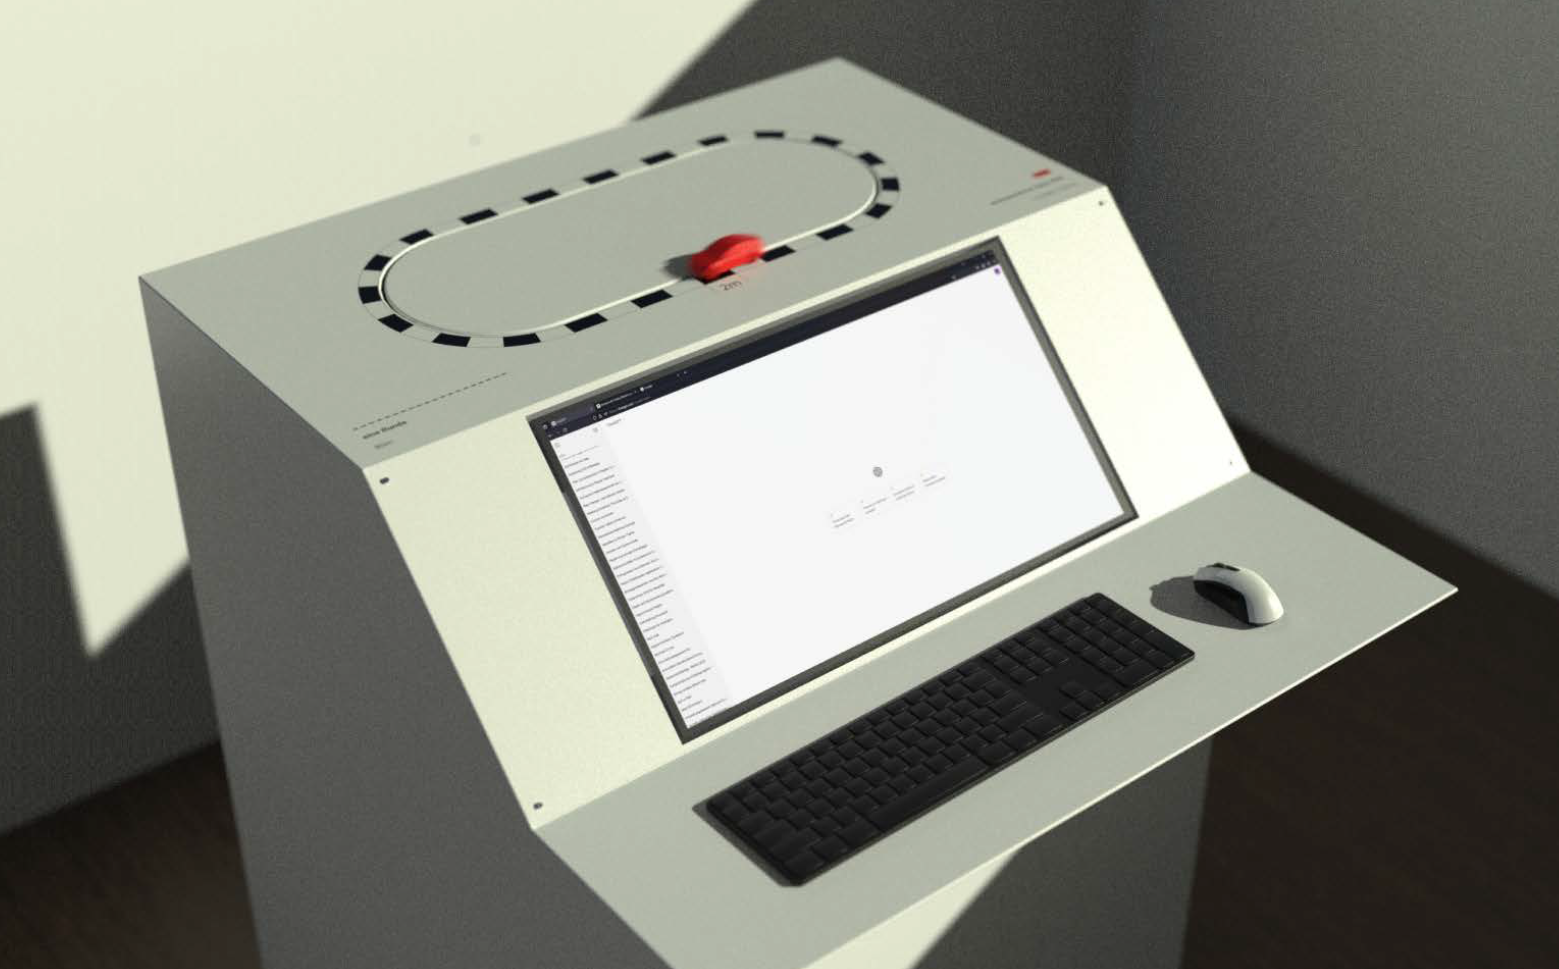
In the first design iteration, I envisioned a looped track instead of a map. The idea was to have the car travel in a continuous circuit, representing the ongoing nature of internet energy consumption. However, this approach had significant drawbacks.
I realized that while the loop concept was interesting, it wouldn't effectively convey the intended message. A map-based design, on the other hand, is more intuitive and familiar. This realization led to the decision to pivot to a map-based design, which would allow for a more straightforward and thought-provoking interaction.